How to Read a Phylogenetic Tree: A Step-by-Step Guide With Practice Trees
Learn to read any evolutionary tree with one simple rule. Built from real primate DNA, this beginner's guide covers clades, rotations, branch lengths, bootstrap values and roots, with eight practice trees and worked answers.
- #phylogenetic tree
- #phylogenetics
- #evolution
- #cladogram
- #bootstrap
- #tree thinking
- #bioinformatics
- #IQ-TREE
Show most people a tree of the apes and they read it like a class photo: whoever stands next to you must be your closest relative. It is one of the commonest ways to misread a phylogenetic tree. The habit fails for a simple reason: the order of the names along the edge is mostly a choice made by whoever drew the tree, and another drawing of the same tree can seat different neighbours side by side.
A phylogenetic tree is a diagram of shared ancestry. It shows which living things share a more recent common ancestor with which others. Biologists use trees to show that birds are a branch of the reptiles, that the yeast in your bread is a closer relative of you than of the wheat, and how a virus spread during an outbreak.
The same few misreadings have turned up in classrooms for at least twenty years (Baum and colleagues, 2005; Meir and colleagues, 2007; Gregory, 2008). This guide replaces them with one rule that works on any rooted tree. Along the way it covers the parts of a tree, why spinning a branch changes nothing, what branch lengths and bootstrap numbers mean, and how roots work.
The primate trees in Figures 1 to 5 all come from one tree, built for this article from the real mitochondrial DNA of ten primates with free software. You can test yourself on eight practice trees with worked answers, and a later section gives the exact steps to rebuild the tree yourself.
The parts of a tree
Every phylogenetic tree is made of the same five parts. Figure 1 labels them on a real tree of ten primates, built from their mitochondrial DNA.
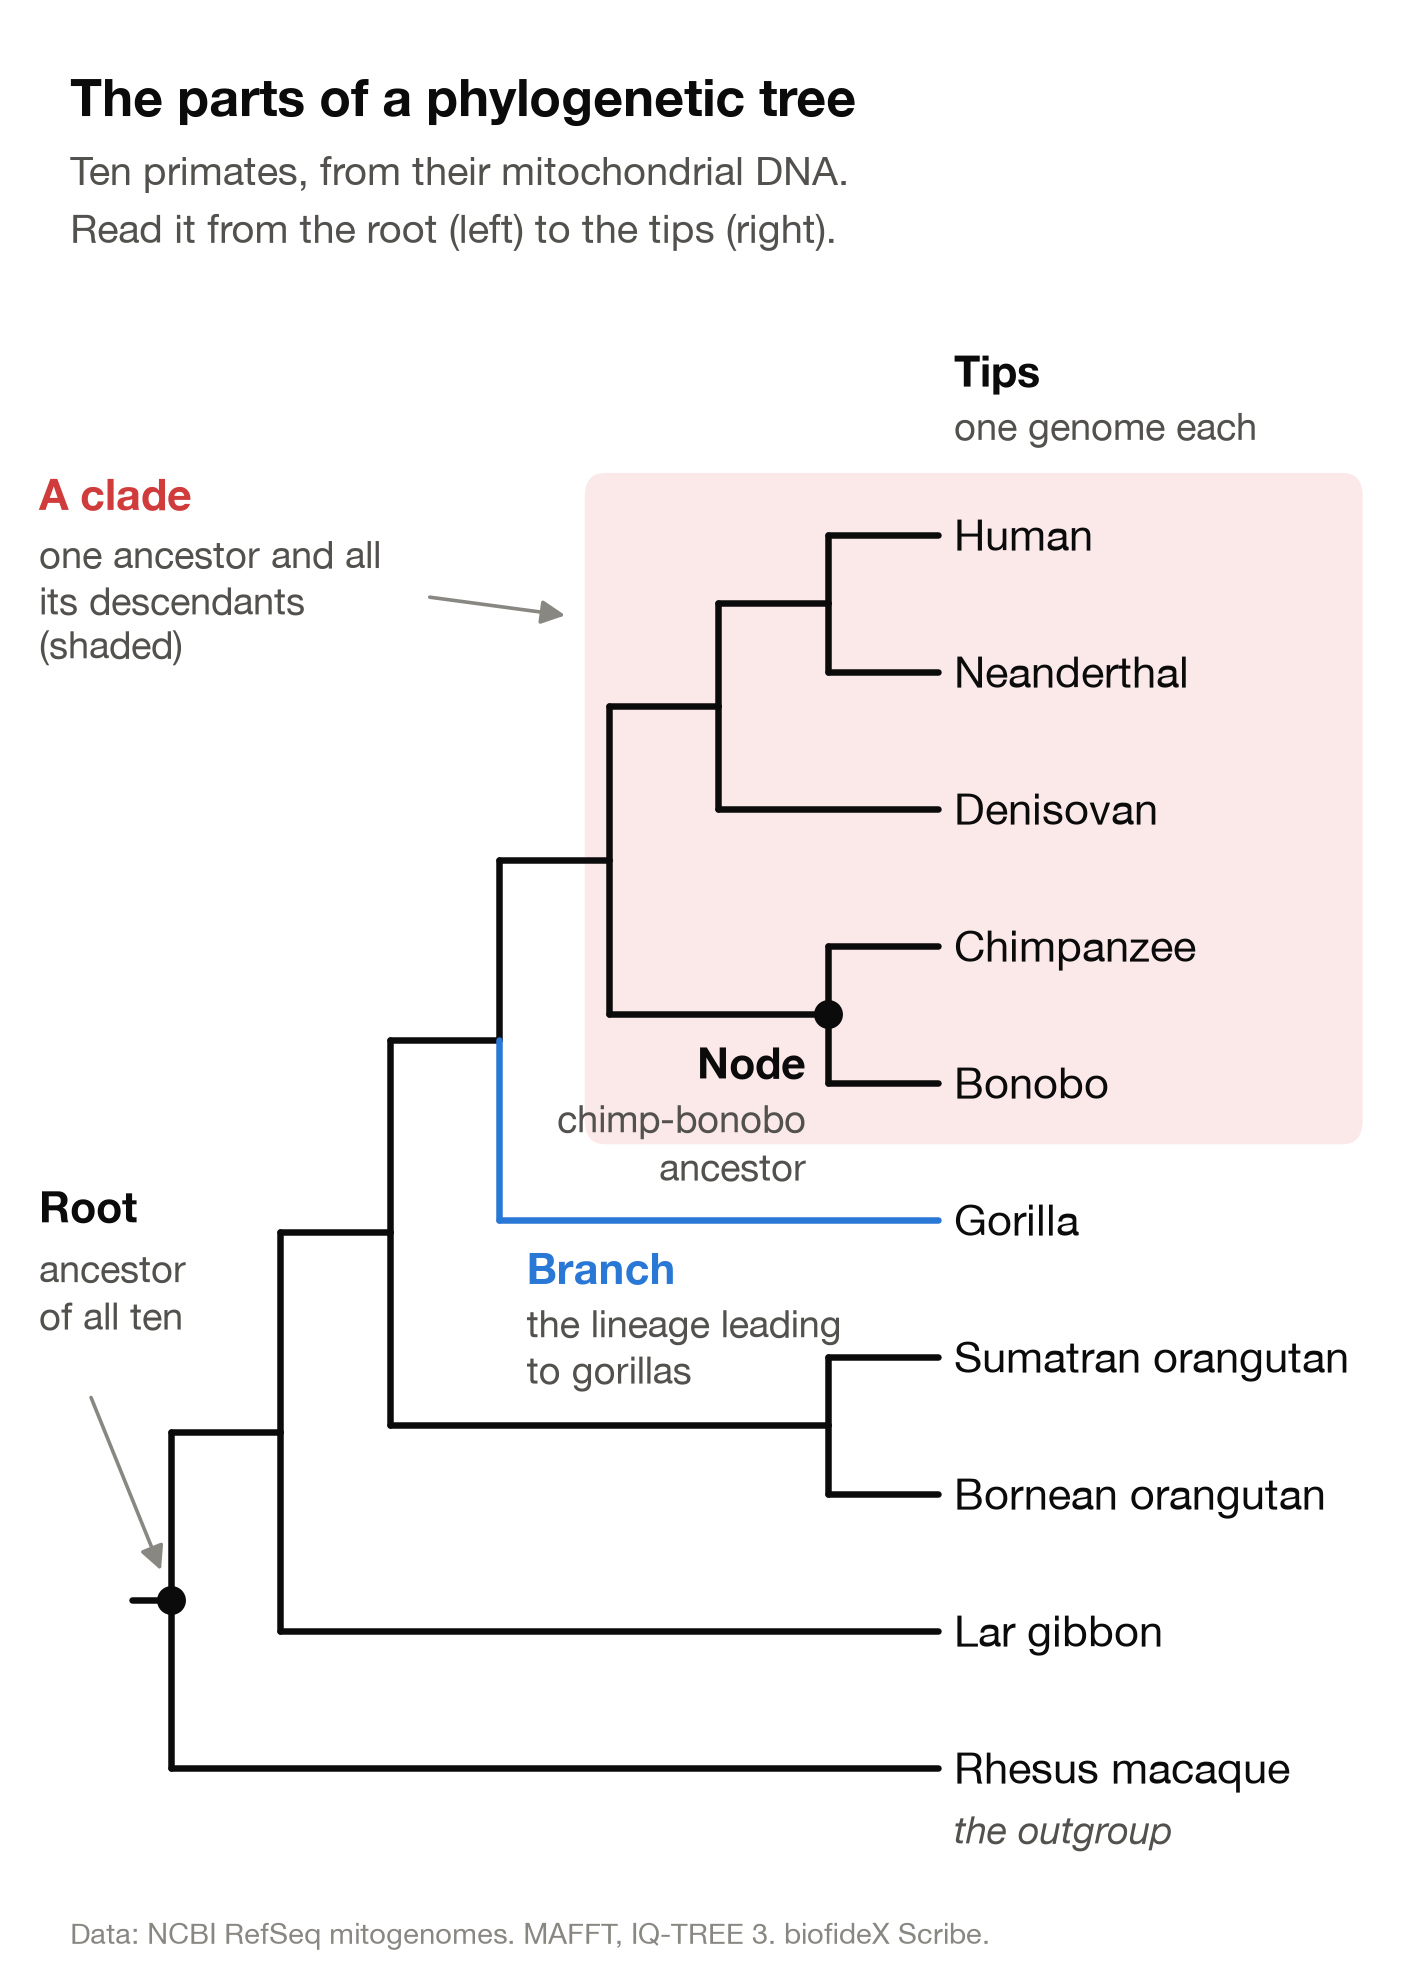
- Tips (also called leaves) are what was sampled: species, individuals or virus genomes. Here each tip is one mitochondrial genome. Tips are the only part of a tree anyone actually observed.
- Branches are lineages: populations passing their genes down through many generations. A branch is not one animal; it is a line of descent through time.
- Nodes are the points where a lineage split in two. Each one stands for a common ancestor that nobody sampled; it is inferred from the tips.
- The root is the deepest node: the common ancestor of everything on the tree. It sets the direction of time, from the root (past) toward the tips (present).
- A clade is one node plus everything that descends from it: every branch, node and tip beyond it, toward the tips. Pick any node, take all that grows out of it, and you have a clade.
A few more words come up all the time. Sister groups are the two lineages that come out of the same node: chimpanzees and bonobos are sisters, and so are the chimp-bonobo pair and the human line. An outgroup is a tip known to sit outside the group you care about, used to place the root; here it is the rhesus macaque, a monkey rather than an ape.
Exam questions also use three older terms. A clade is a monophyletic group. A group that starts from one ancestor but leaves out some of its descendants is paraphyletic, such as "reptiles" without birds; a group that pulls together lineages from different branches without their shared ancestor is polyphyletic, such as "warm-blooded animals" for birds plus mammals.
The one rule: find the most recent common ancestor
How closely two tips are related depends on one thing only: how recently they shared an ancestor. On a tree, that ancestor is the node where their lines meet when you trace them back toward the root. Biologists call it their most recent common ancestor, or MRCA.
You can do this with two fingers:
- Put one finger on the tip you are asking about, and another on the first candidate relative.
- Slide both fingers back along the branches, toward the root, until they meet at a node. Remember that node.
- Do the same with the second candidate. Walking back from your first tip toward the root, whichever meeting node you reach first is the more recent ancestor, so that candidate is the closer relative. If both meet your tip at the same node, they are equally related to it.
Try it on Figure 1. Is the gorilla more closely related to humans or to orangutans? Gorilla and human meet at the node just left of the shaded box. Gorilla and orangutan only meet one node further back, so the gorilla is closer to humans, even though it sits right next to the orangutans on the page.
Two consequences of the rule surprise most people. First, relatedness is always a comparison of at least three tips. "Are gorillas closely related to humans?" has no answer from a tree; "Are gorillas closer to humans or to orangutans?" does.
Second, tips that share an ancestor are equally related to everything outside their group. Humans and chimpanzees reach the gorilla through the same node, so chimpanzees are no closer to gorillas than we are. The chimpanzee is not a halfway point between us and the other apes; it is our cousin, with its own long history since we split.
Rotating branches changes nothing
Think of a tree as a mobile hanging from the ceiling, with each node a joint that turns freely. You can spin any node so the two branches leaving it swap sides, and the tree means exactly the same thing, because every tip keeps the same ancestors. Figure 2 shows one tree of seven primates drawn four ways.
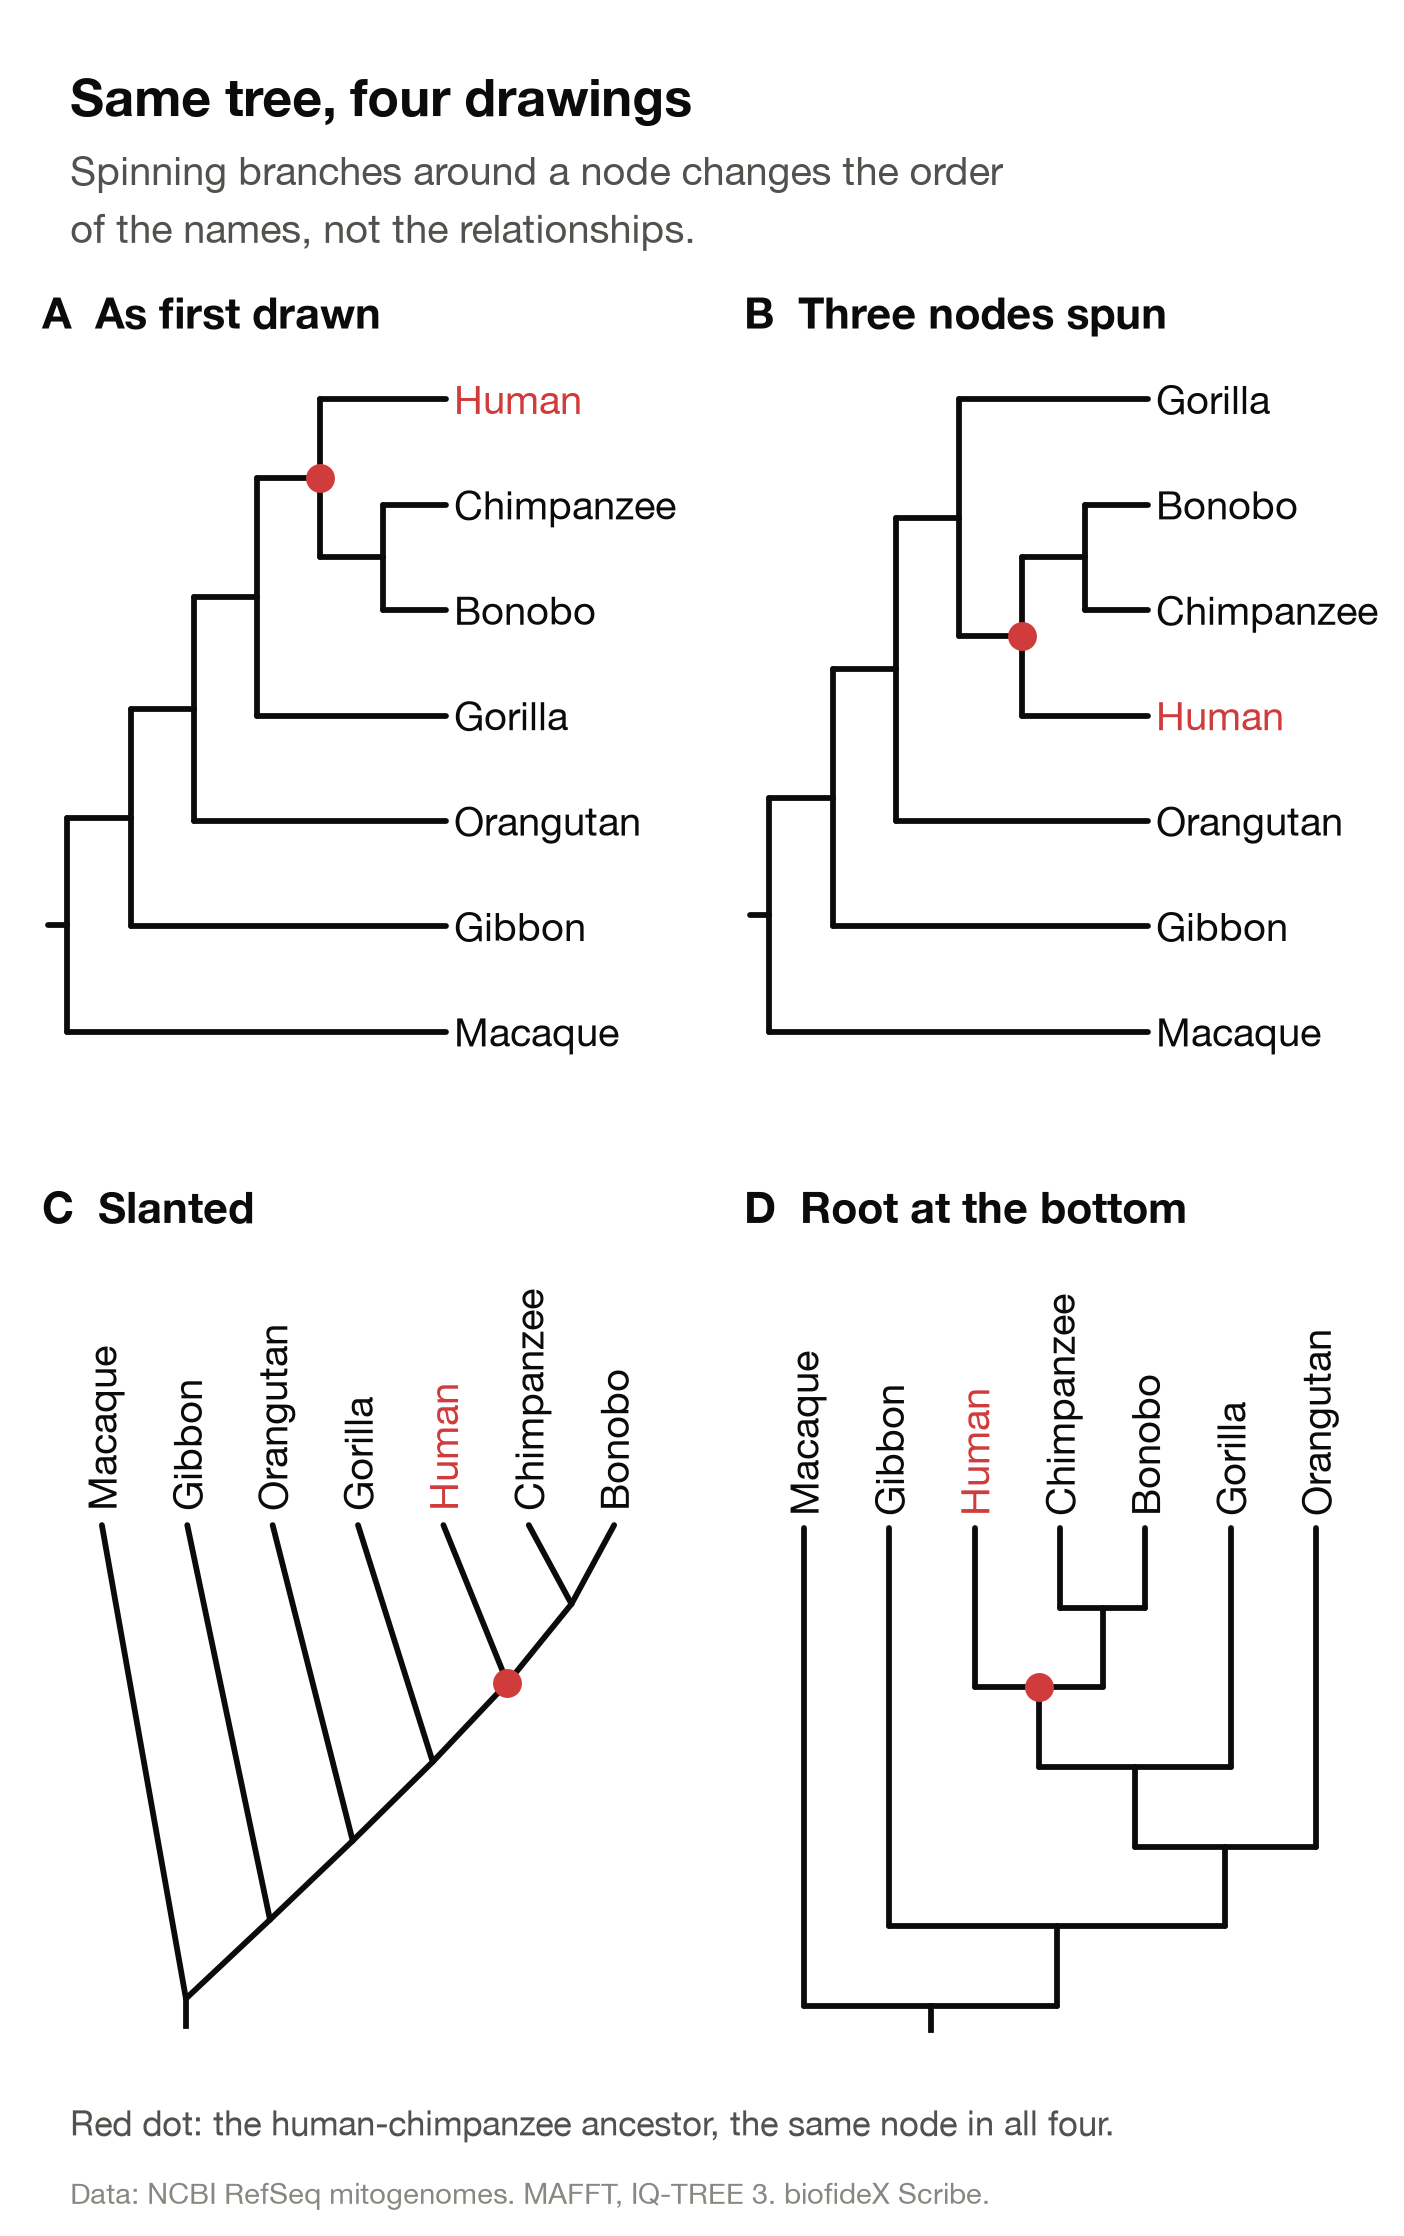
Look at what spinning did to our neighbours. In drawing B humans sit next to orangutans, and in D next to gibbons. Yet in every drawing, the human line meets chimpanzees and bonobos at the red dot before it meets anything else, so they remain our closest relatives on this tree.
This freedom is bigger than it looks. A tree that splits in two at every node has one node fewer than it has tips, and each node can be spun, so a tree of n tips can be drawn in 2n−1 orders. The seven-primate tree has 64 correct drawings; the ten-primate tree in Figure 1 has 512. If the order of the names carried meaning, 511 of those would be lying.
Five common misreadings
Many wrong answers about trees, in exams and in the news, come from five habits. Each has a quick fix.
Misreading 1: neighbours on the page are closest relatives
The order of the tips is a drawing choice, as Figure 2 showed. The fix is the one rule: trace back to the most recent common ancestor, every time, and ignore who sits next to whom.
Misreading 2: counting the nodes between two tips
It feels logical that fewer nodes between two tips means closer relatives. But the count depends on how many other tips happen to be on the tree. In Figure 1, the path from gorilla to human passes four nodes and the path from gorilla to chimpanzee passes three, which suggests gorillas are closer to chimpanzees.
Now look at Figure 2, which leaves out the Neanderthal, the Denisovan and one orangutan. The counts become two and three, which suggests the opposite. The relationships never changed: gorilla meets human and chimpanzee at the same node, so it is equally related to both.
Misreading 3: some living species are higher or more advanced
A ladder-shaped drawing like Figure 2C invites you to read it as a march of progress, ending at whatever sits on the far right (in Figure 2C, that happens to be the bonobo). But every living tip is the end of a lineage exactly as old as every other, because all of them trace back to the same root. Since our lineages split, macaques have been evolving for exactly as long as we have; they have adapted to a different way of life.
The words primitive and basal cause the same trouble. A lineage that splits off near the root, like the macaque here, is sometimes called basal, but that describes where the split sits, not the animal. Traits can be ancestral (macaques kept the tail that apes lost), but on a tree like this one, no tip is the ancestor of another tip.
Misreading 4: one living species evolved from another
"Humans evolved from chimpanzees" reads a tip as if it were a node. Living species sit at the tips and ancestors sit at the nodes, and no ancestor on this tree is alive today. The human-chimpanzee ancestor was neither a human nor a chimpanzee: the populations that became the two species separated roughly 6 million years ago, by one genome-wide estimate (Scally and colleagues, 2012). The red dot in Figure 2 follows mitochondrial DNA, so it sits somewhat earlier, because gene lineages separate before species do.
The same goes for extinct tips. The Neanderthal in Figure 1 lived tens of thousands of years ago, yet it sits at the end of its own side branch. The tree does not say Neanderthals were our ancestors; it says we share an ancestor with them.
Misreading 5: a gene's tree is the species' tree
Every tree so far comes from mitochondrial DNA, which mothers pass to their children as a single block. It tells the history of that one block. Figure 1 puts the Denisovan outside the human-Neanderthal pair, just as the first Denisovan mitochondrial genome did (Krause and colleagues, 2010).
The Denisovan nuclear genome, published the same year, told a different story: Denisovans share a common origin with Neanderthals (Reich and colleagues, 2010). Both results are right. They are histories of different pieces of DNA.
Two processes cause this. Genetic variety already present in an ancestral population can be passed unevenly to the species that split from it, which biologists call incomplete lineage sorting; and groups that meet again can interbreed and carry DNA across, which is called introgression. Both are common: for about 30% of the gorilla genome, the gorilla comes out closer to humans, or to chimpanzees, than those two are to each other (Scally and colleagues, 2012).
For the Denisovan puzzle, the leading explanation is introgression. Neanderthals seem to have picked up mitochondrial DNA from an early relative of modern humans, and it replaced their own (Posth and colleagues, 2017).
So a tree from one stretch of DNA is one witness. The whole mitochondrial genome counts as a single stretch, because it is inherited in one piece; a species tree is built by weighing many independent stretches from across the genome.
Branch lengths, scale bars and bootstrap numbers
So far we have read only the branching order. Many trees carry two more layers of information: how long the branches are, and how much the data support each grouping.
Three words first. An alignment lines DNA sequences up so that each column holds bases descended from the same position in an ancestor, and each column is called a site. A substitution is one base replaced by another as a lineage evolves, and a model of evolution is the set of rules the software assumes for how often each kind of substitution happens.
Three ways to draw branch lengths
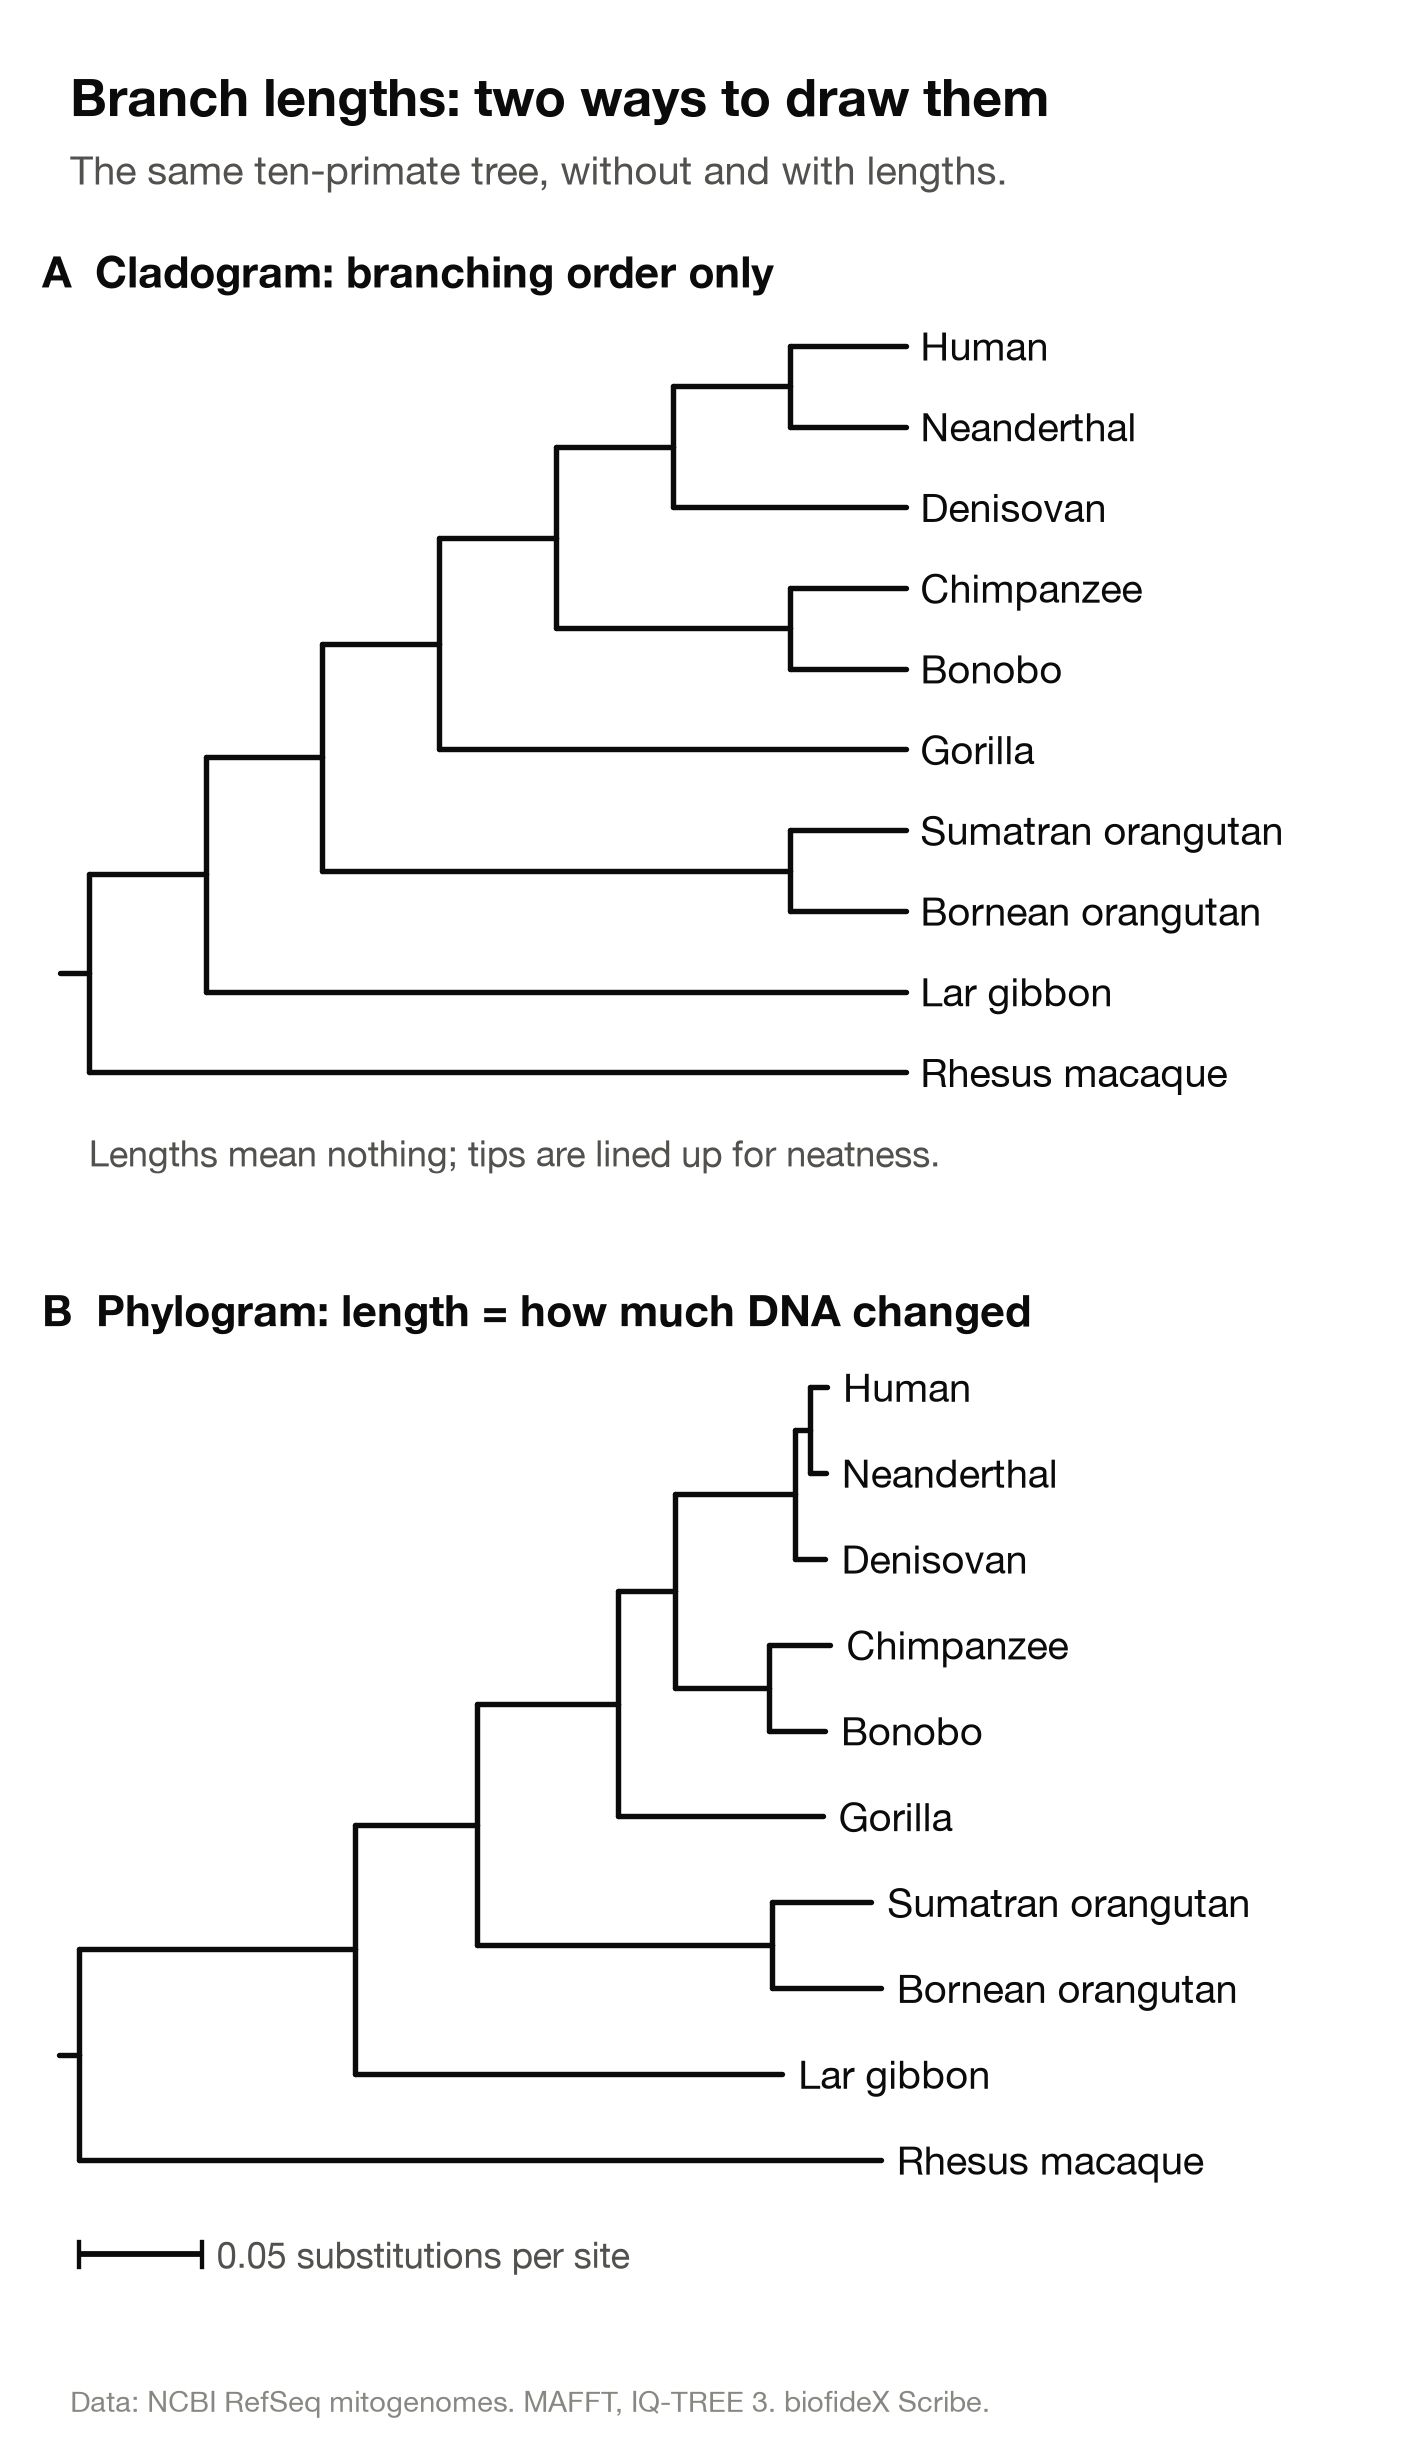
- A cladogram shows branching order only. Its branch lengths mean nothing, and the tips are lined up for neatness. Figures 1 and 2 are cladograms.
- A phylogram draws each branch in proportion to the genetic change along it, and comes with a scale bar. Tips do not line up, because lineages change at different speeds.
- A time tree, or chronogram, draws branches in proportion to time, with an axis in millions of years. Living species line up at the present, and the depth of a node estimates when the split happened.
A quick test tells them apart: a scale bar means a phylogram, a time axis means a time tree, and neither means you should ignore the lengths.
Reading a scale bar
In a phylogram, only horizontal distance counts; the vertical lines just connect branches. To compare two tips, add up the horizontal length of every branch on the path between them and compare the total with the scale bar.
On Figure 3B, the path from human to chimpanzee adds up to 0.125 substitutions per site, about 12 or 13 changes per 100 bases. Human to Neanderthal is only 0.013. The two orangutan species are 0.085 apart, almost twice the 0.048 between chimpanzees and bonobos, a difference you cannot see at all in the cladogram above it.
Substitutions per site is an estimate, not a count. Line up the human and chimpanzee genomes and 8.8% of the bases differ (1,456 of the 16,547 positions where both have a base). The tree says 0.125 because its model also estimates the changes you can no longer see, where a base changed twice or changed back. The gap grows with distance: human and macaque differ at 21% of bases, but the tree puts them 0.63 apart.
What bootstrap numbers mean
The numbers printed at nodes, usually from 0 to 100, are support values. The most common kind is the bootstrap (Felsenstein, 1985). The software builds a new data set of the same size by picking columns of the alignment at random, with replacement, so some columns are picked twice or more and others are left out.
It builds a tree from that new data set, repeats the process 100 or 1,000 times, and counts how often each grouping comes back. A value of 83 means the grouping appeared in 83 of 100 replicate trees. It measures how consistently the data point to that grouping; it is not the probability that the grouping is true.
A common rule of thumb treats 70 or more as reasonable support. It comes from a 1993 simulation study: when rates of change were equal and trees symmetrical, values of 70 or more usually meant at least a 95% chance that the grouping was real, but under very fast or very uneven change even values above 50 could overstate it (Hillis and Bull, 1993).
Two other numbers look similar but are read differently. Ultrafast bootstrap values from IQ-TREE are trusted from 95 upward for single-gene trees (IQ-TREE FAQ). Bayesian posterior probabilities run from 0 to 1, are usually trusted from about 0.95, and often come out higher than bootstrap values for the same grouping; the methods section tells you which number you are reading.
A test: the same DNA, in smaller pieces
To see what support values really do, we rebuilt the ten-primate tree from small pieces of the same DNA. Mitochondrial DNA is inherited as one block, so every piece shares a single true history, the one the whole genome recovers in Figure 4B. Any disagreement comes mostly from having too little data.
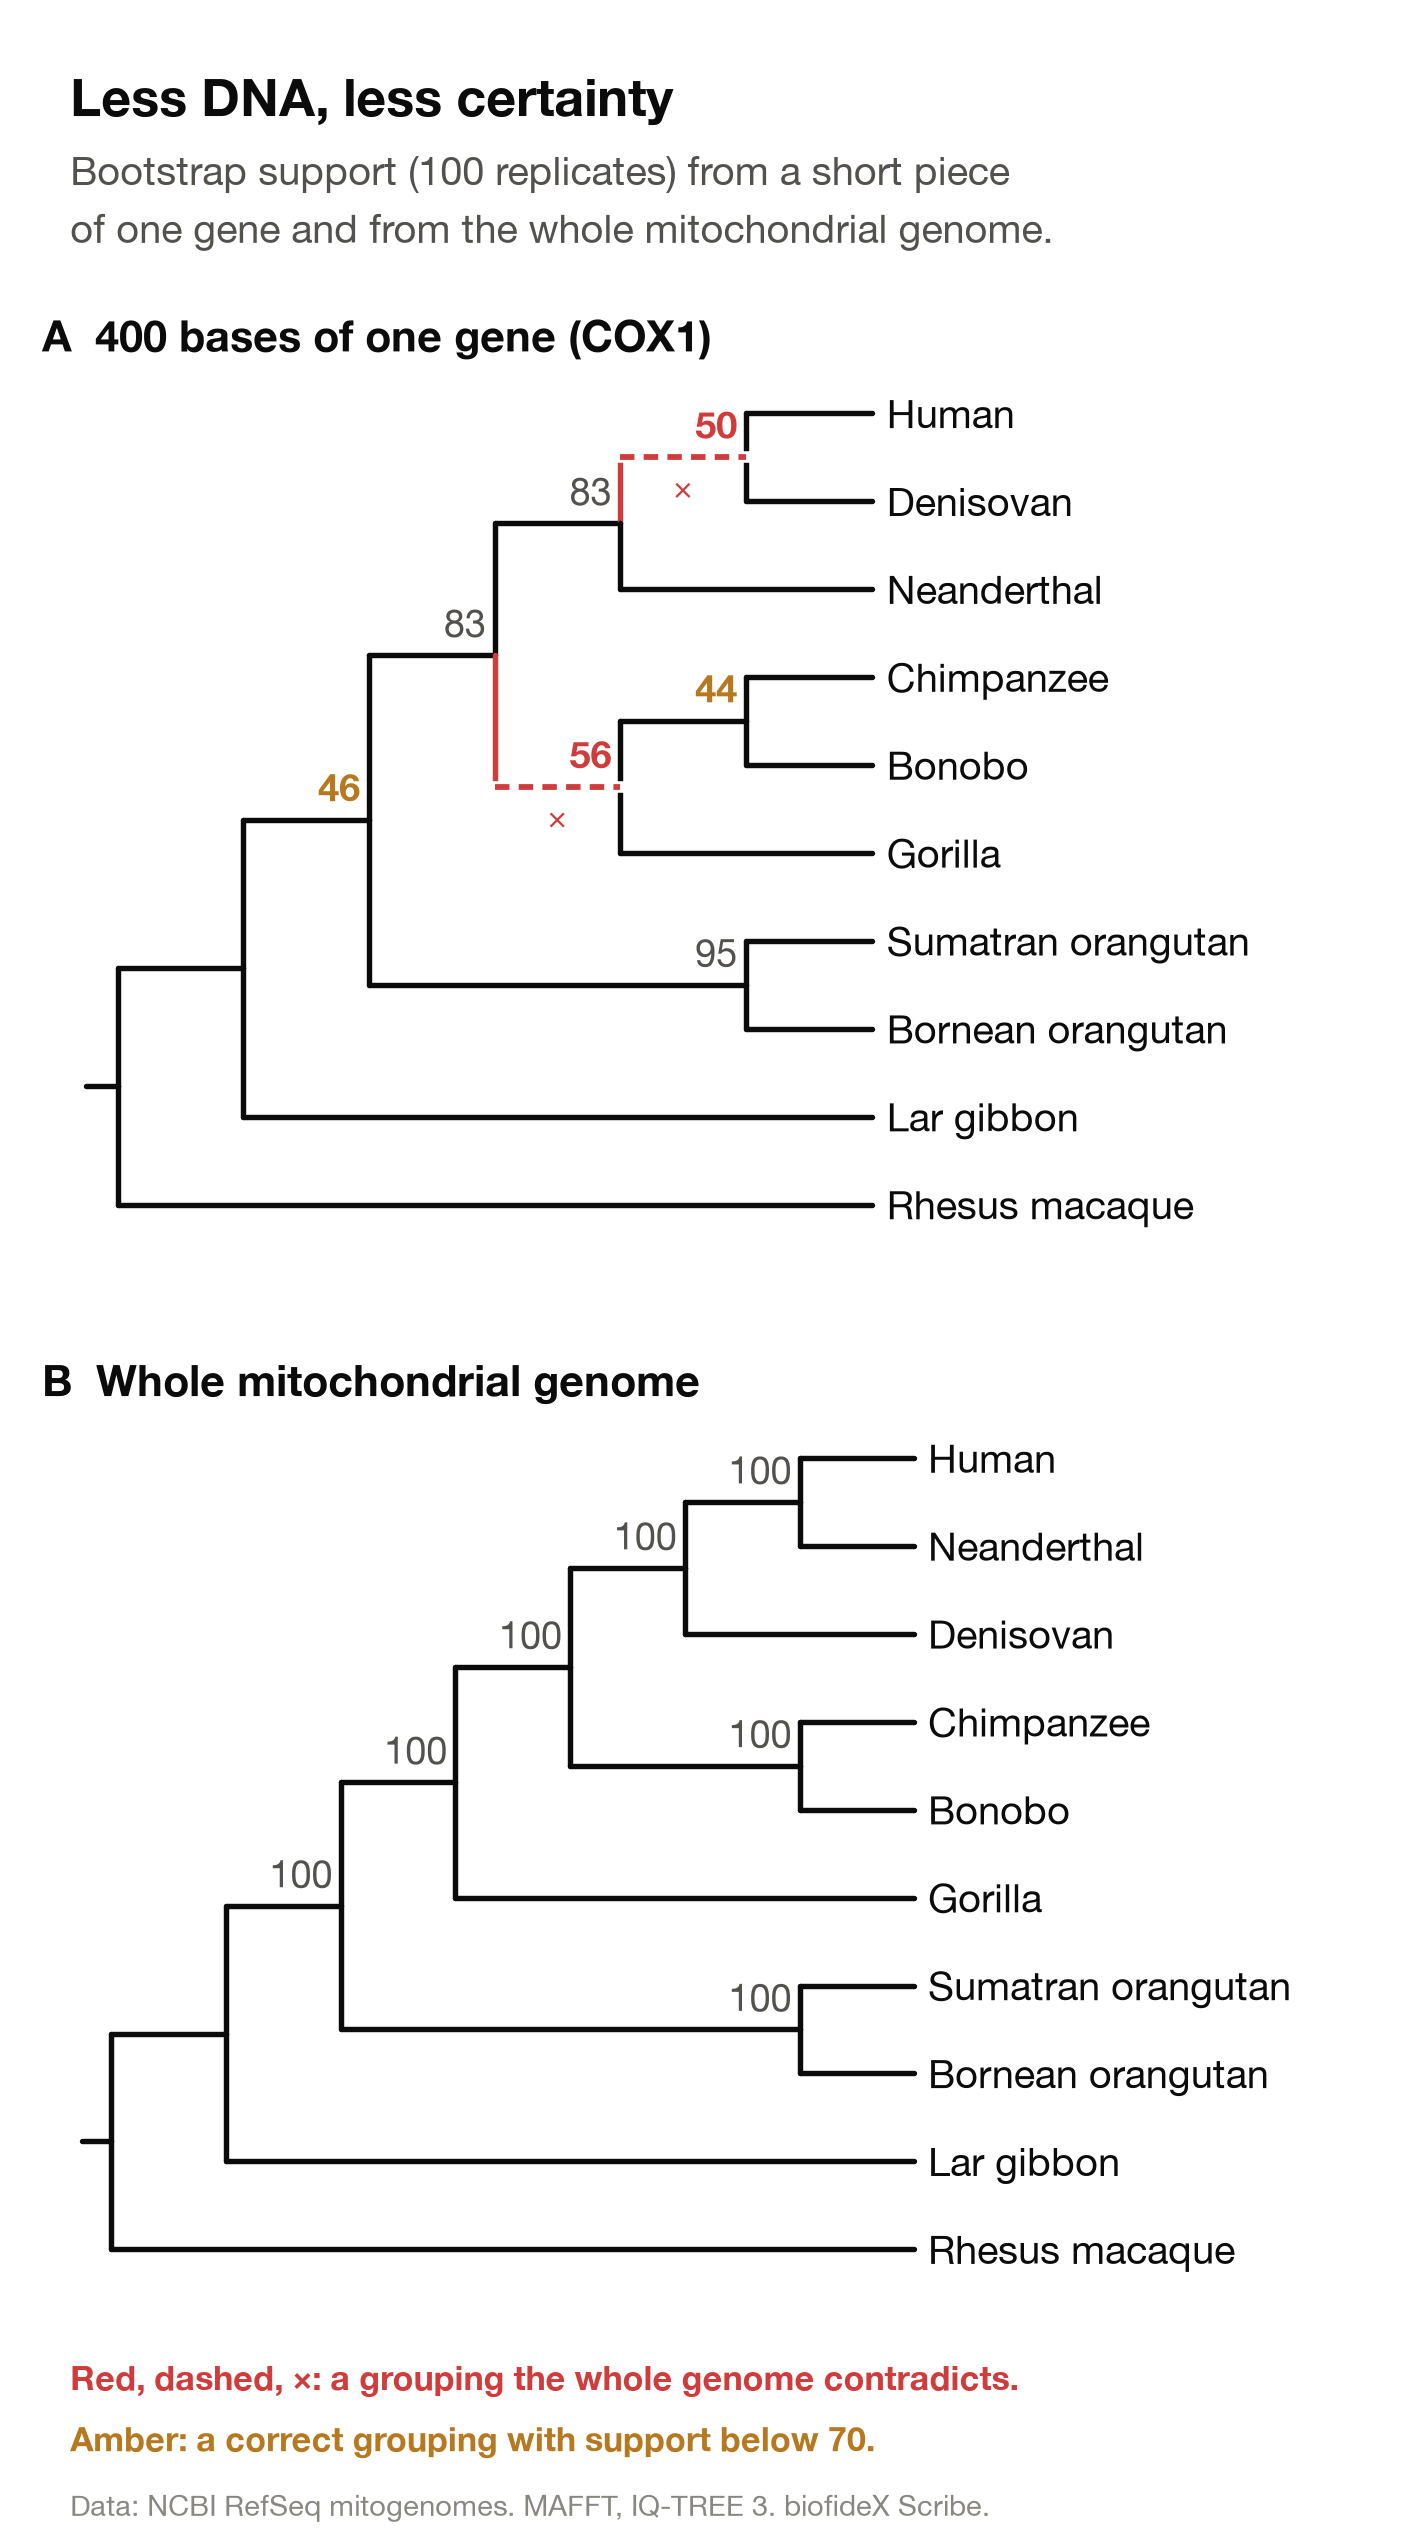
We repeated this for six genes, building one tree from a 400-base piece of each and one from the whole gene:
- About 400 bases of one gene: 8 wrong groupings, at least one in every tree; 2 of them scored above 70 (73 and 74). The lowest support at any node was 30.
- One whole gene (681 to 1,542 bases): 4 wrong groupings, in 3 of the 6 trees, all below 70. The lowest support at any node was 45.
- The whole mitochondrial genome (16,737 bases): no wrong groupings, and support of 100 at every node.
Low support was a useful warning: six of the eight wrong groupings from 400-base pieces scored below 70. But it cuts both ways. Ten of the 16 groupings that scored below 70 were in fact correct, so low support means unresolved, not wrong.
High support is not proof either. Two wrong groupings scored 73 and 74, because a short piece can point consistently in the wrong direction, and the bootstrap only measures consistency. One of them, Denisovan with Neanderthal, is wrong only for the mitochondrial history; it matches the nuclear genome. The same caution applies to Figure 4B: a value of 100 says this stretch of DNA tells one consistent story, not that the story is the species' history.
Rooted and unrooted trees, and outgroups
Most tree-building methods produce an unrooted tree. They work out which tips group together, but not which end of the tree is the past, so the result is a pattern of splits with no direction of time (Figure 5A).
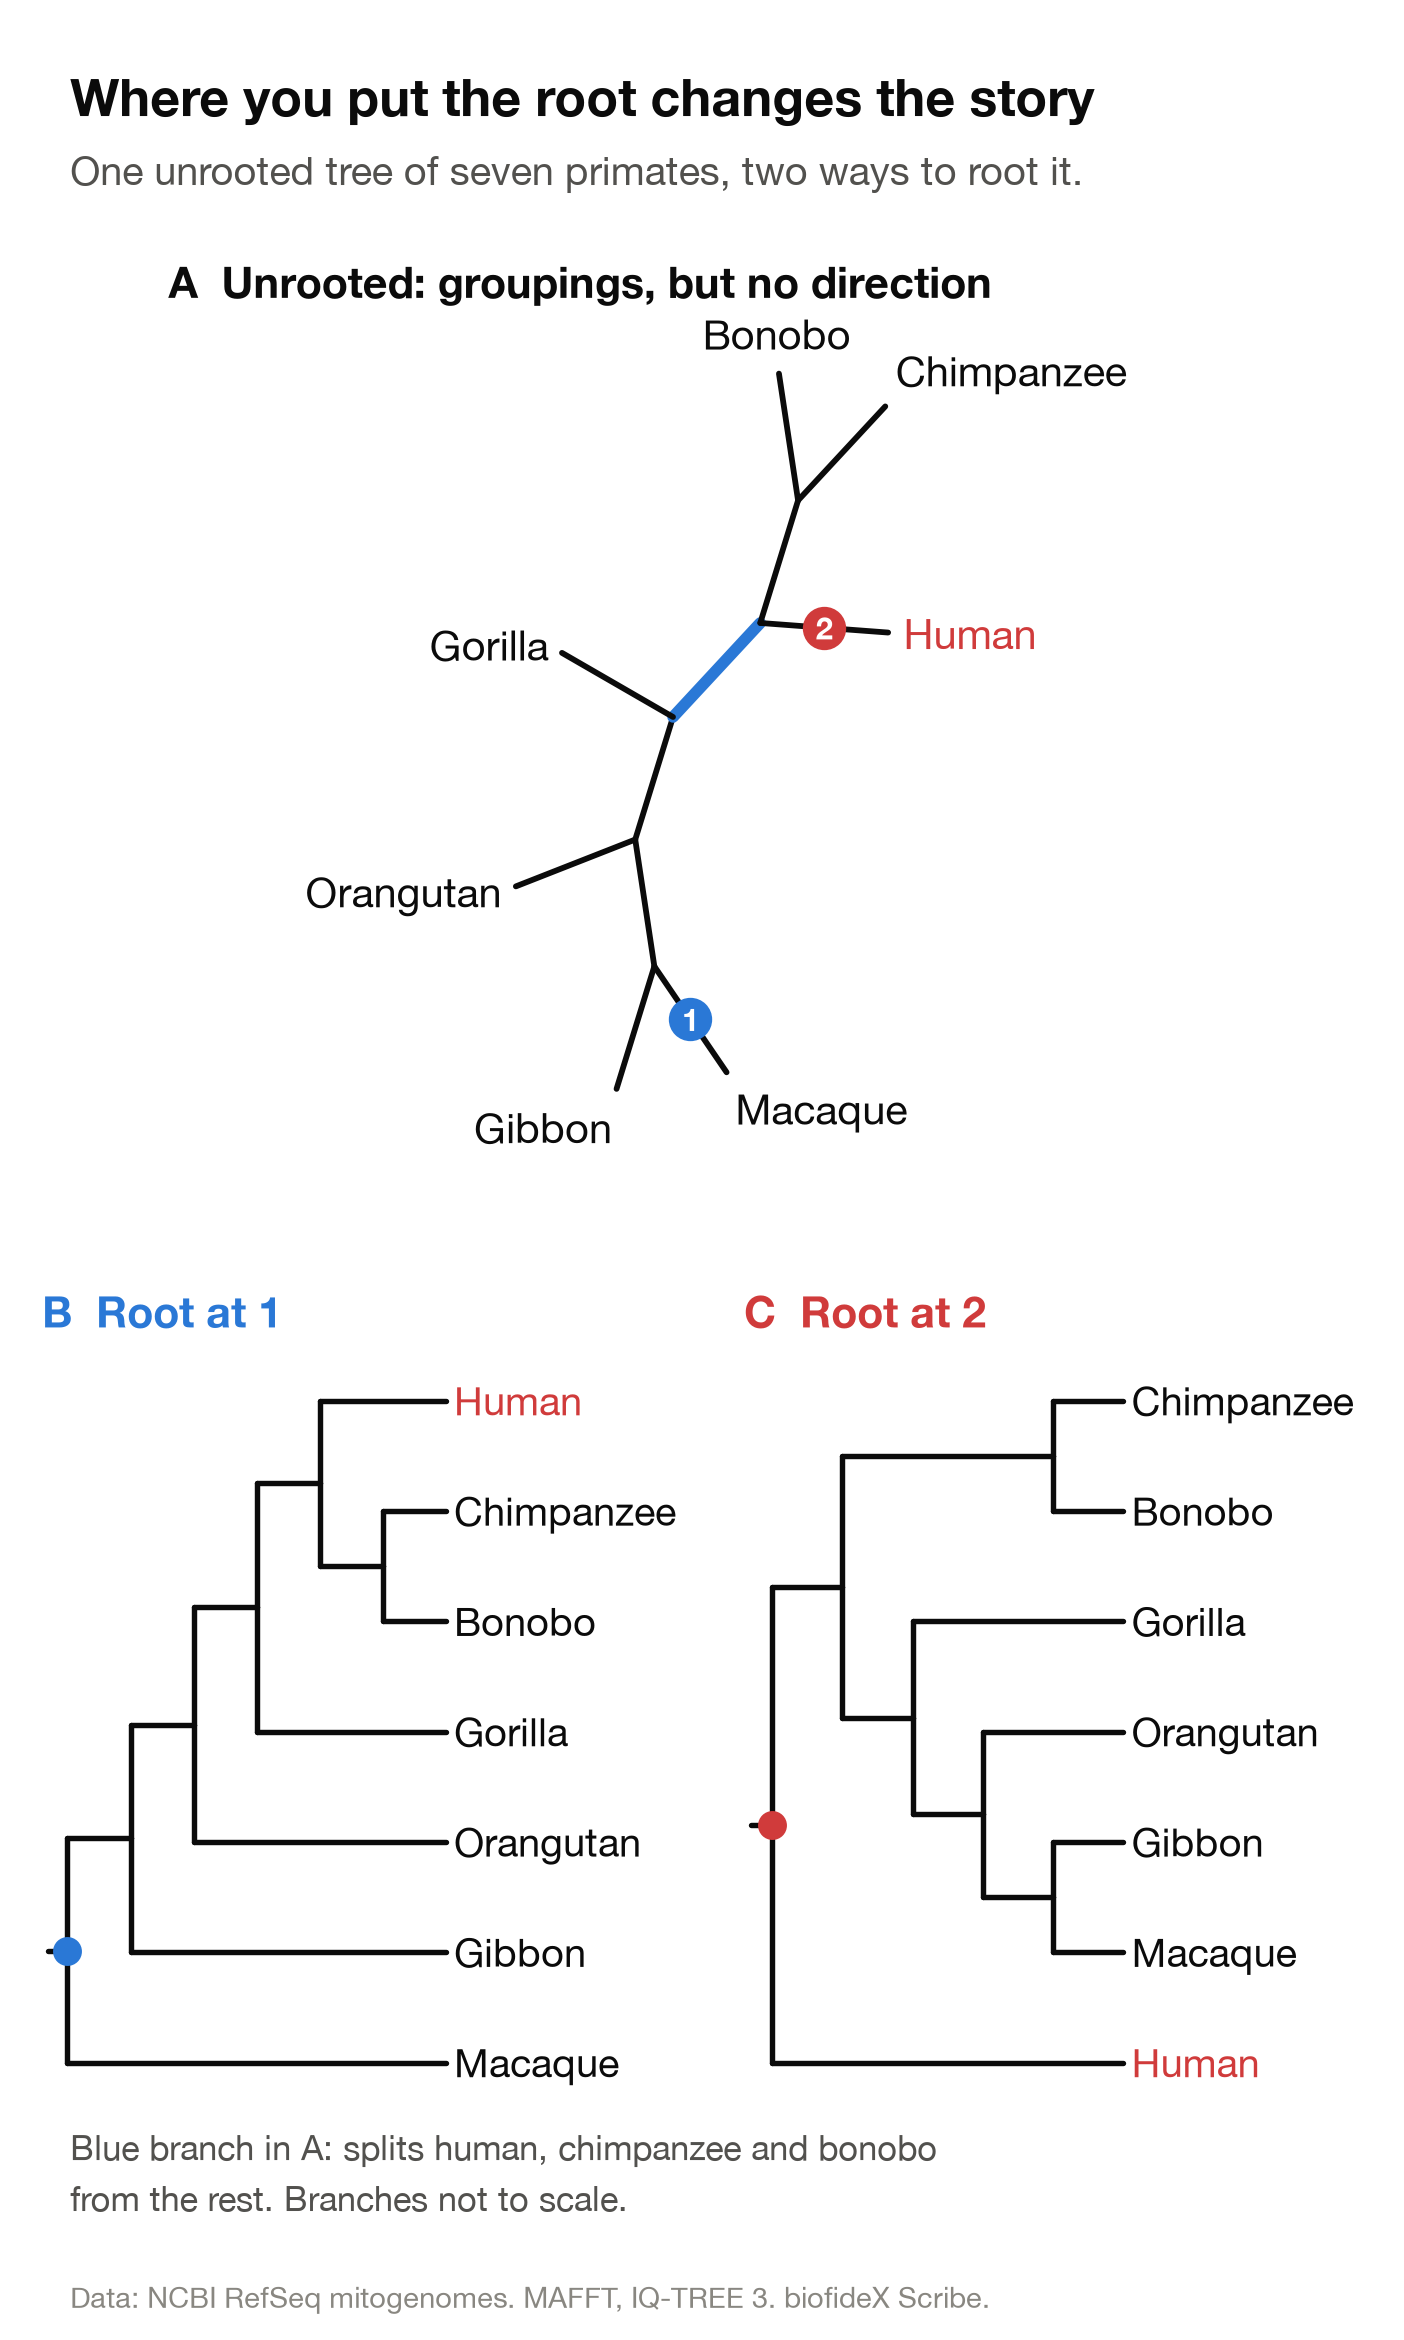
Rooting means choosing the point on the tree that stands for the oldest ancestor. The groupings stay the same, yet the story the tree tells changes. Tree C is drawn from exactly the same data as tree B; only the root moved.
What you can read without a root
An unrooted tree still shows splits: sets of tips separated from all the others by a single branch. In Figure 5A, one branch (drawn in blue) separates human, chimpanzee and bonobo from the rest, and that group will be a clade under any root placed outside it. What you cannot read is direction: which lineage split off first, who is sister to whom, or which ancestor is most recent.
Three ways to place a root
- An outgroup. Include a tip that other evidence puts outside the group you care about: any monkey for a tree of apes, or a fish for a tree of land vertebrates. The root goes on the branch that joins the outgroup to everything else. Choose one that is clearly outside, but not so distant that its DNA has changed beyond recognition, or its long branch may attach in the wrong place.
- The midpoint. Put the root halfway along the longest path between any two tips. This assumes all lineages changed at roughly the same speed, which is often close enough for close relatives. Figure 3B uses it to place the root along the macaque's branch; here the midpoint and the outgroup agree on that branch.
- Dates. Methods that build time trees, and virus studies that know when each sample was collected, can place the root as part of estimating when each split happened.
A checklist for reading any tree
Run through these six questions whenever you meet a new tree, in a paper, a textbook or a news story:
- Where is the root? If there is none, read only which tips group together, not which came first.
- What do the branch lengths mean? A scale bar means genetic change, a time axis means time, and neither means ignore them.
- Who shares the most recent ancestor? Trace tips back to where they meet; ignore who sits next to whom and how many nodes lie between.
- How strong is the support? Check the numbers at the nodes you care about. Treat standard bootstrap values below 70, or ultrafast values below 95, as unresolved.
- What was sampled? Note which genes and how many species. One gene can tell a different story from the whole genome, and adding species changes node counts.
- Am I reading tips as ancestors? Living species are cousins, never parents, and none of them is higher or more advanced than another.
Eight practice trees
Each tree tests one idea from above, from easy to tricky. Answer the questions on paper before you look at the answers in the next section; say your reason out loud, because the reason is what an examiner marks.
Practice tree 1: five vertebrates
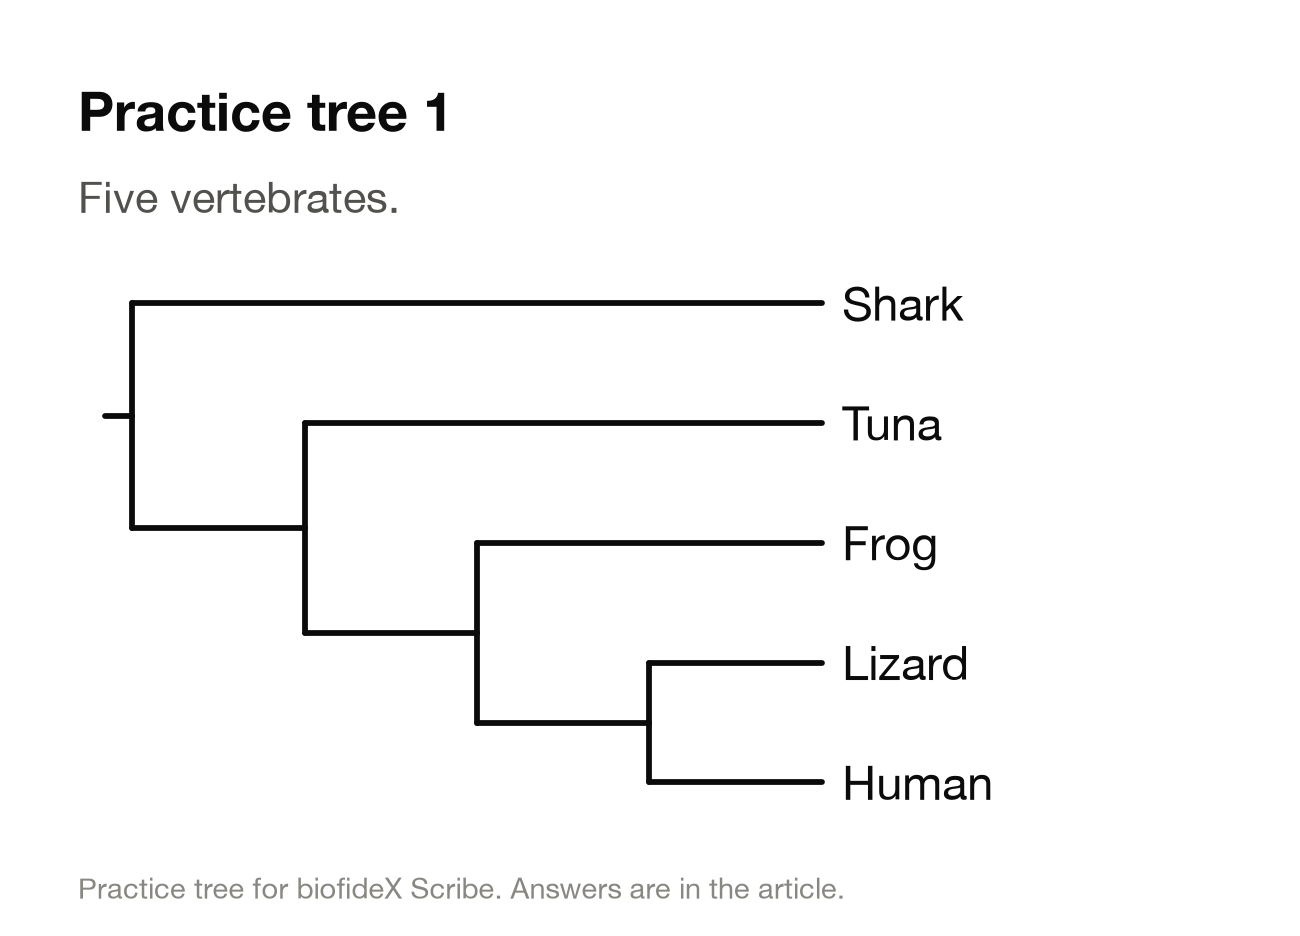
Q1. Is the tuna more closely related to the shark or to the human?
Q2. Is "fish", meaning the shark and the tuna, a clade on this tree?
Practice tree 2: spot the odd one out
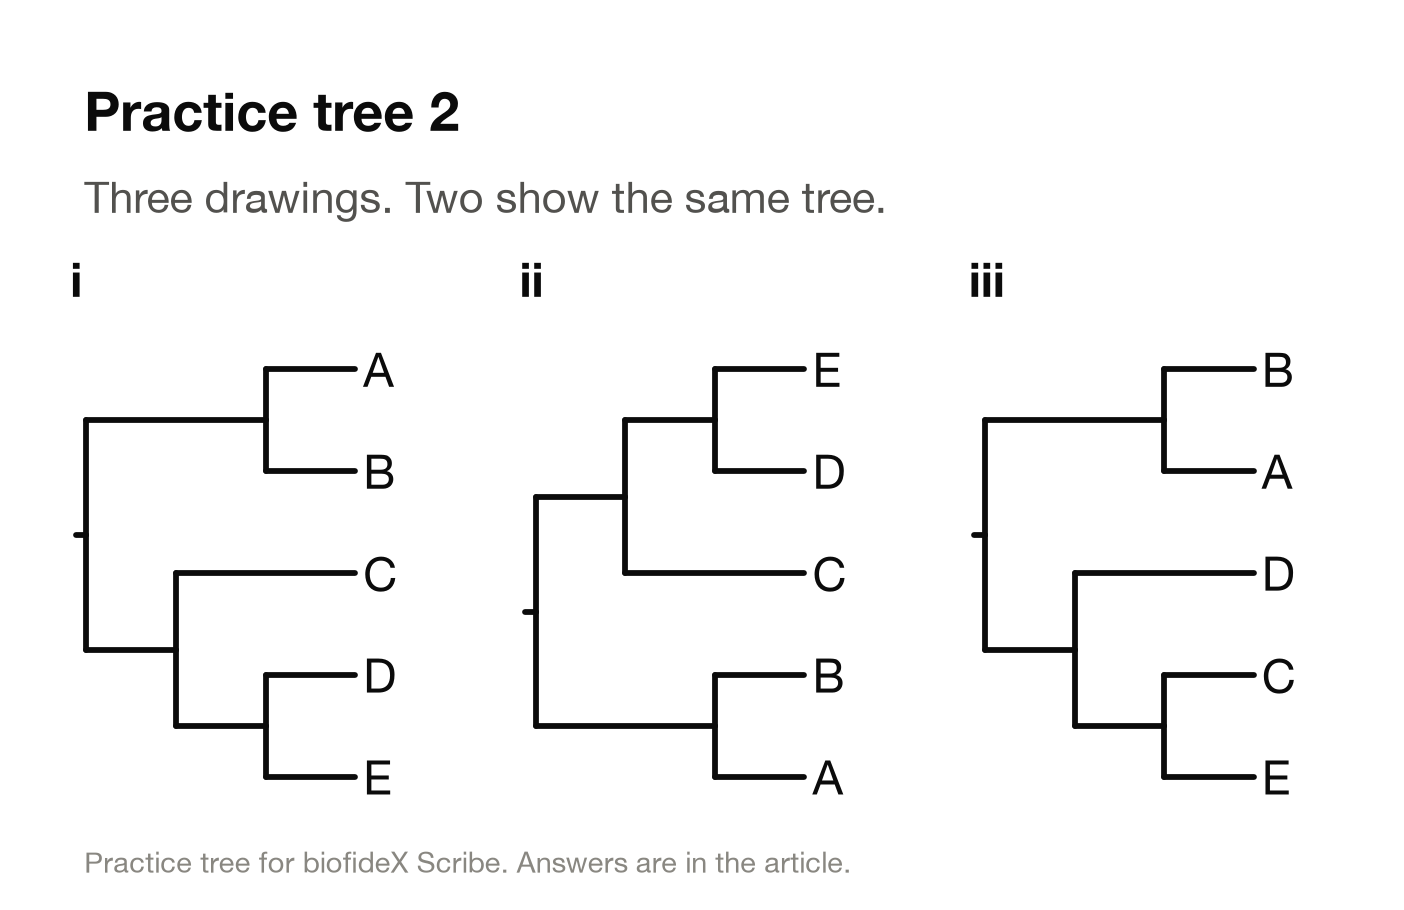
Q3. Which drawing shows a different tree from the other two? Name the clade that gives it away.
Practice tree 3: reptiles and birds
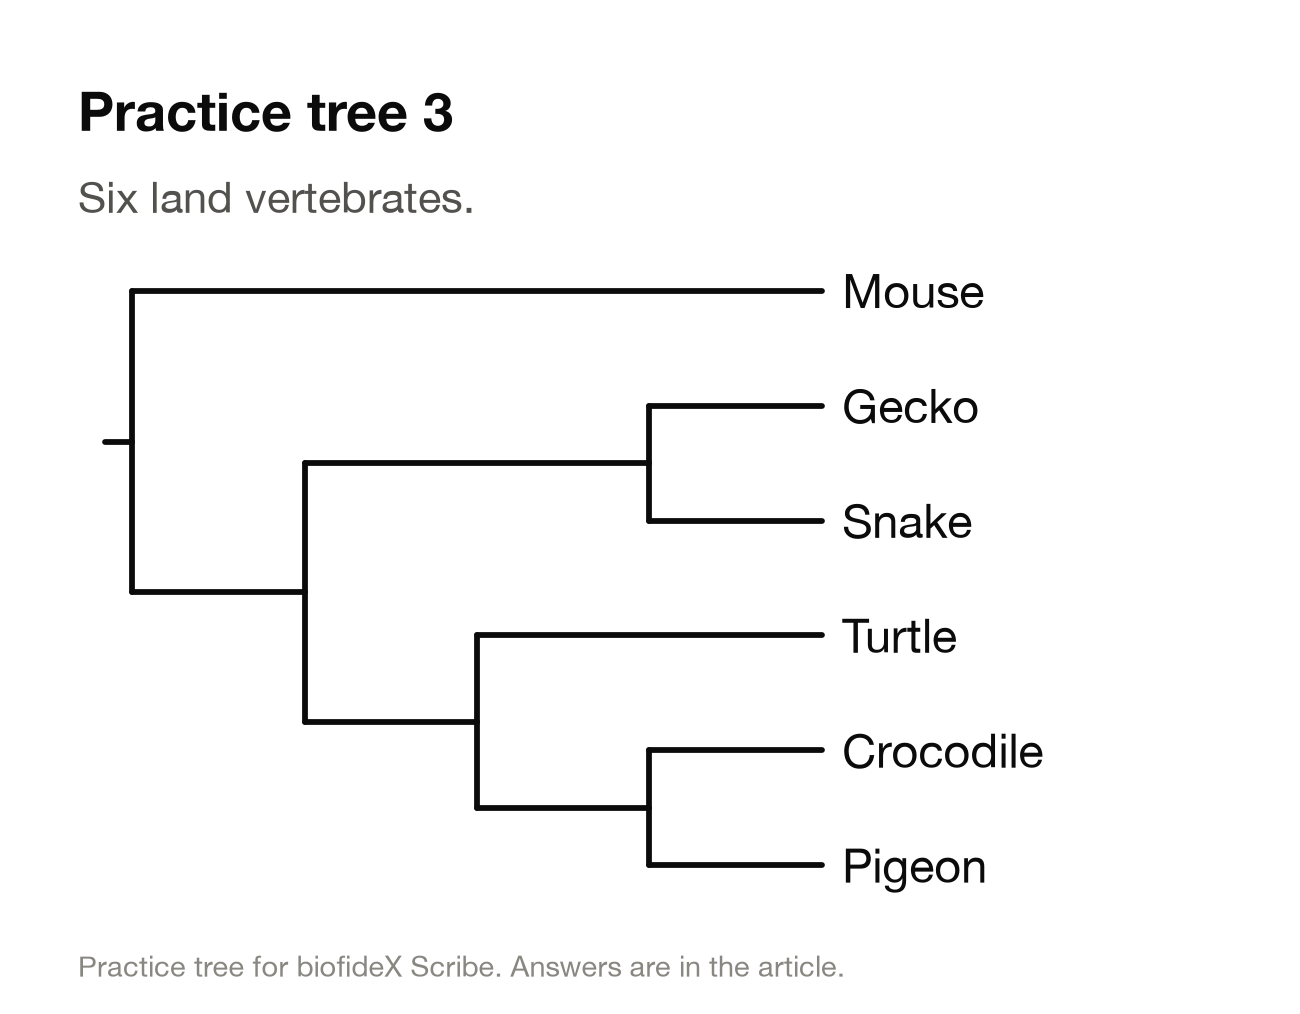
Q4. What is the smallest clade that contains both the turtle and the crocodile?
Q5. Is the group of gecko, snake, turtle and crocodile, without the pigeon, a clade?
Practice tree 4: mushrooms
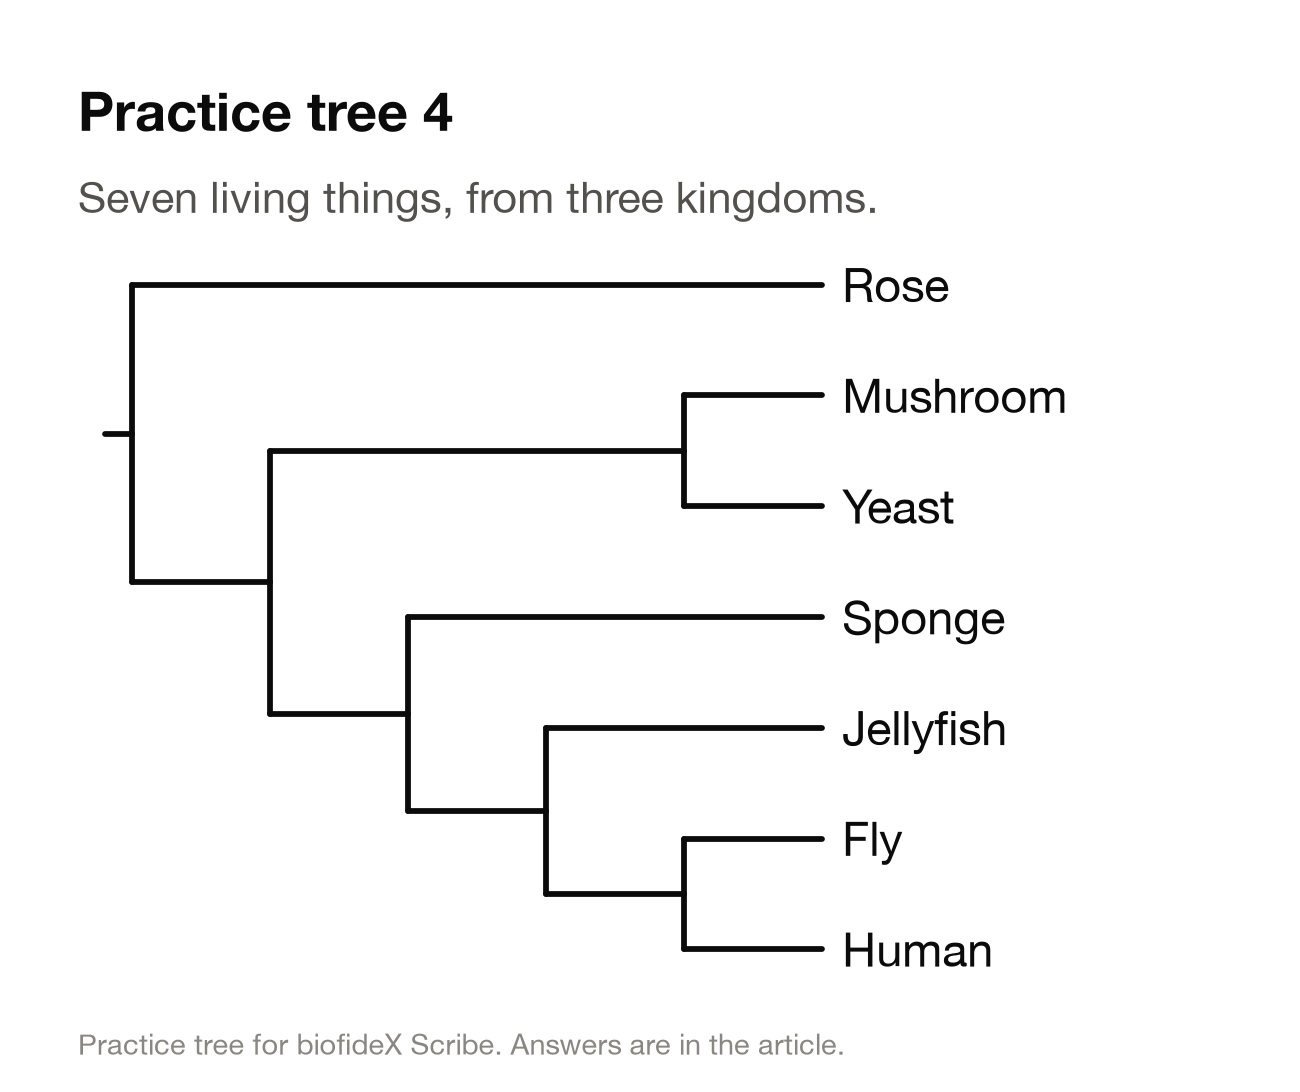
Q6. Count the nodes on the path from mushroom to rose, then from mushroom to human. Now use the one rule instead: is a mushroom more closely related to a rose or to a human?
Practice tree 5: reading a scale bar
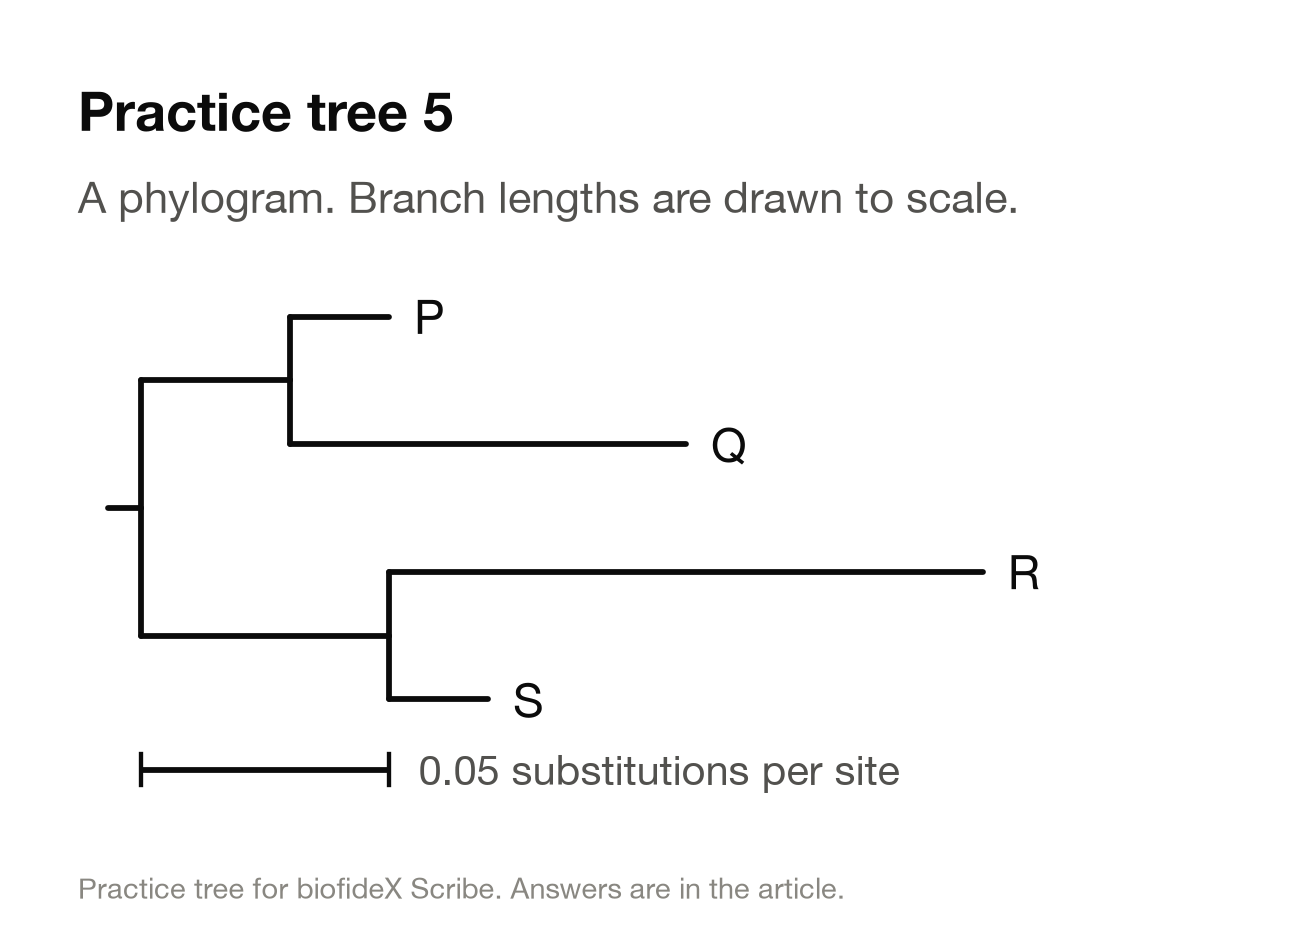
Q7. Which tip has changed the most since the root?
Q8. Using the scale bar, roughly how many substitutions per site separate P from Q? And R from S?
Q9. Is R an older species than S?
Practice tree 6: support values
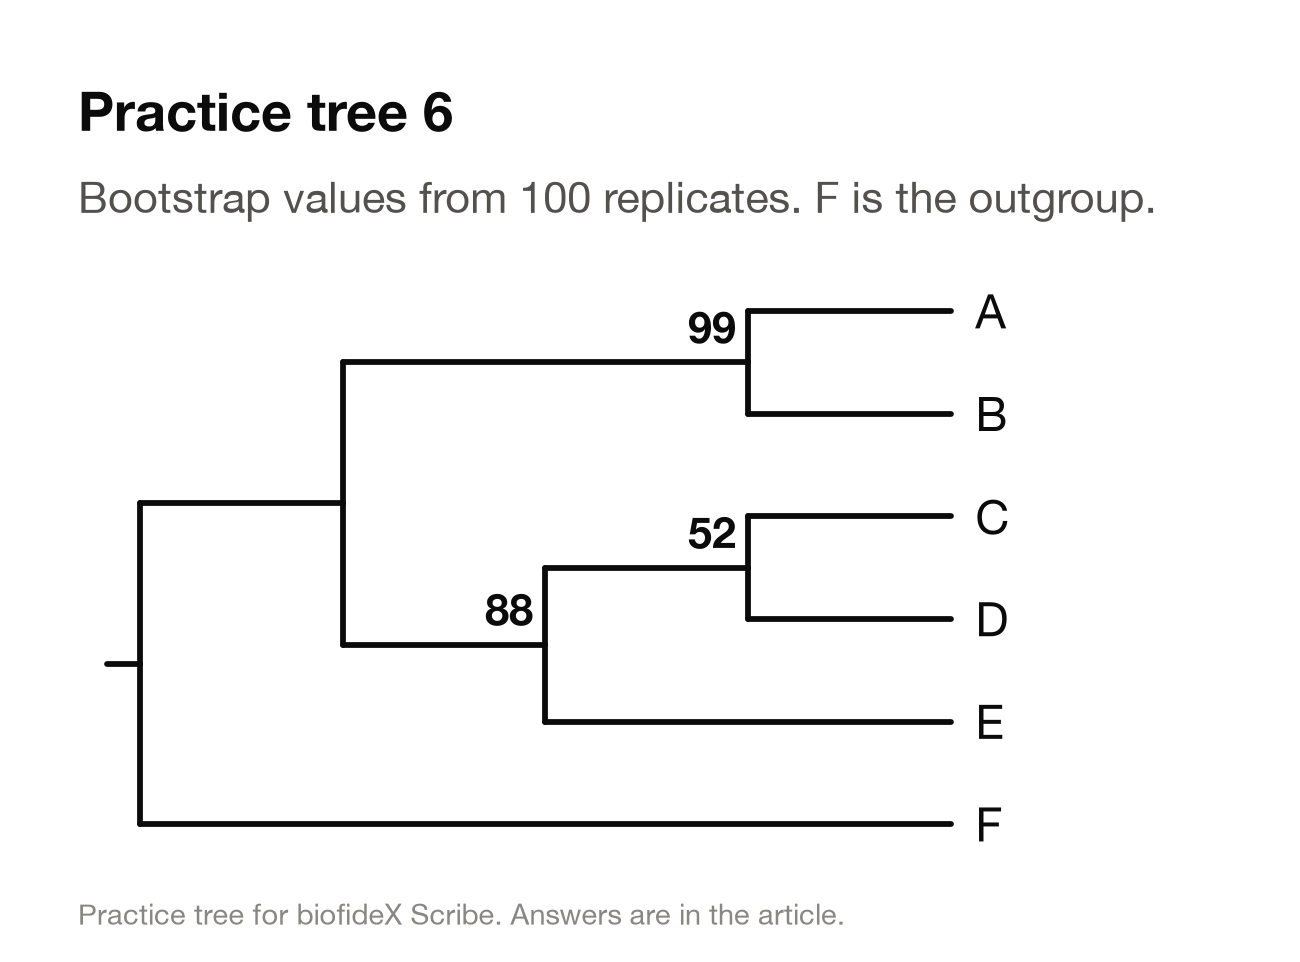
Q10. Which of these could you report with confidence? (a) A and B are each other's closest relatives. (b) C and D are each other's closest relatives. (c) C, D and E form a clade.
Practice tree 7: no root yet
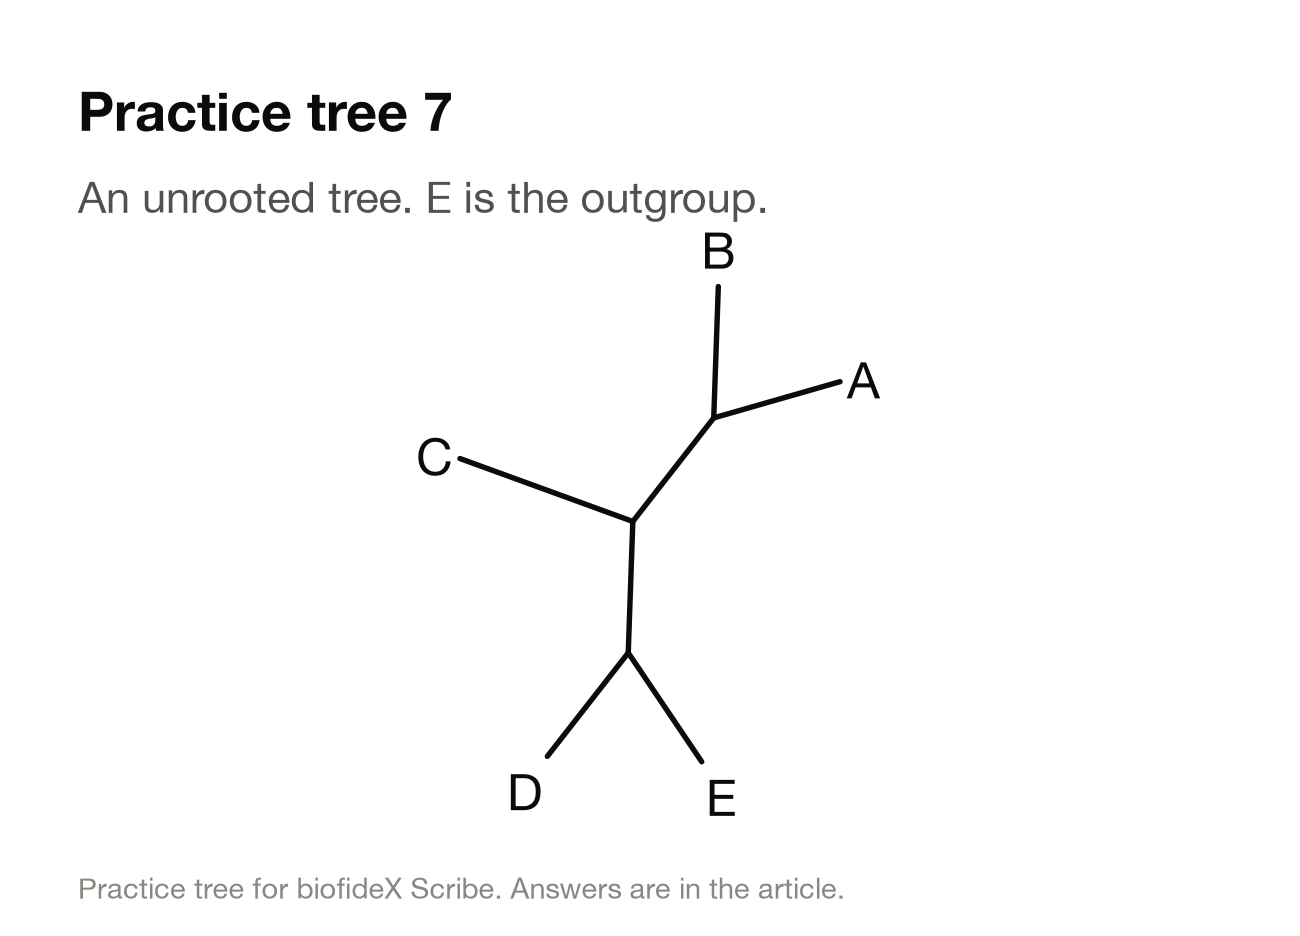
Q11. Root the tree on the branch leading to E. What is the sister group of C?
Q12. If D had been the outgroup instead, would A and B still form a clade?
Practice tree 8: the ladder trap
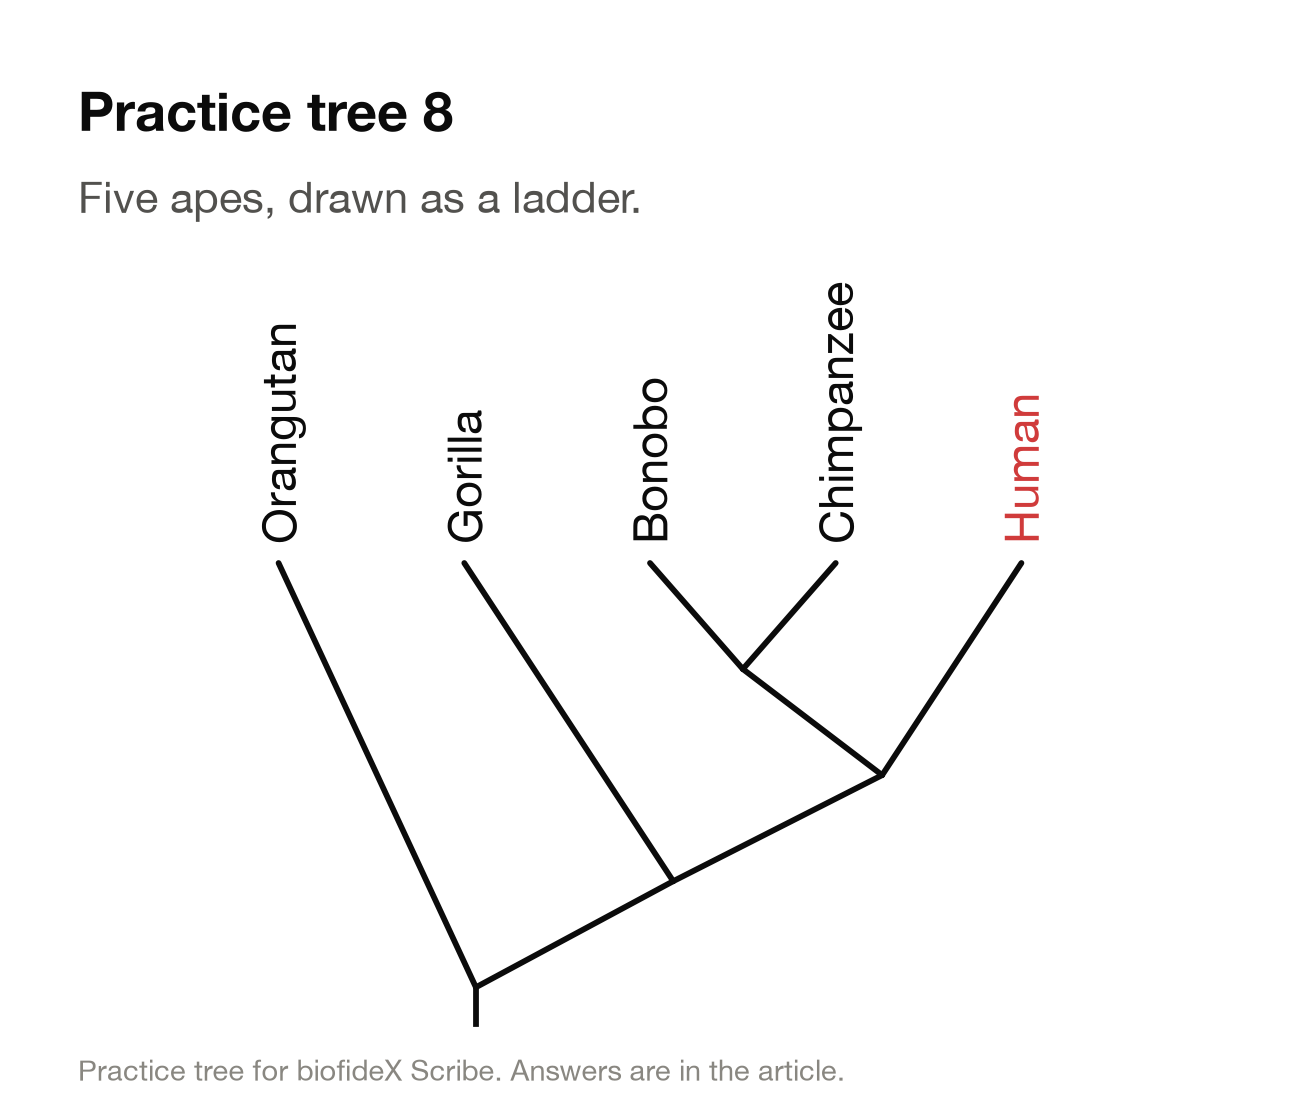
Q13. A classmate makes three claims about this tree. Which does it support? (a) Humans evolved from chimpanzees. (b) The orangutan is the most primitive ape here. (c) Gorillas are more closely related to chimpanzees than to humans.
Answers to the practice trees
Q1. The human. Trace back from the tuna: it meets the human at the node it shares with the frog, lizard and human, but meets the shark only at the root. Sitting next to the shark on the page means nothing.
Q2. No. The smallest clade that holds both the shark and the tuna is the whole tree, which includes the frog, the lizard and you. "Fish" in the everyday sense is a paraphyletic group: it starts from one ancestor but leaves out some of its descendants, including us. The tuna is a closer relative of land animals than of sharks.
Q3. Drawing iii. Drawings i and ii are the same tree spun around: both contain the clades {A, B}, {D, E} and {C, D, E}. Drawing iii pairs C with E instead of D with E, so it is a different tree, however similar it looks.
Q4. Turtle, crocodile and pigeon. The node where the turtle and the crocodile meet is also an ancestor of the pigeon, so the pigeon comes with them. Where turtles belong was argued over for decades; genome-scale data place them as the sister of crocodiles and birds (Crawford and colleagues, 2012).
Q5. No. The ancestor shared by the gecko, snake, turtle and crocodile is also the ancestor of the pigeon, and a clade must include every descendant. The traditional group "reptiles" is only a clade if birds are counted as reptiles, which is how biologists now treat them. In exam terms, reptiles without birds are paraphyletic.
Q6. The human, despite the node count. The path from mushroom to rose crosses three nodes; the path from mushroom to human crosses five, only because more animals were sampled. The rule gives the real answer: mushroom and human meet at the node that joins fungi and animals, while mushroom and rose meet only at the root. That fungi and animals are each other's closest relatives has been known since the early 1990s (Baldauf and Palmer, 1993).
Q7. R. Add the horizontal lengths from the root: R is about 0.17 substitutions per site from the root, more than any other tip (Q is next, at about 0.11).
Q8. About 0.10 and 0.14. P to Q adds 0.02 and 0.08; R to S adds 0.12 and 0.02. Only the horizontal parts of the path count.
Q9. No. R and S split from the same node at the same moment, so their lineages are exactly as old as each other. R's long branch means its DNA changed more, perhaps because its lineage evolved faster.
Q10. (a) and (c) yes, but not (b). A and B as a pair has support 99. C, D and E as a group has 88, good enough to report with its number. C and D as a pair has only 52: the data barely prefer it over C with E or D with E, so it should be called unresolved.
Q11. The A and B pair. Rooting on E's branch gives a tree that reads, from the root: E splits off, then D, then C, which is the sister of the A and B pair.
Q12. Yes. Any root placed outside a group keeps that group a clade. D lies outside A and B, so A and B stay together, whichever of C, D or E is the outgroup.
Q13. None of them. (a) Humans and chimpanzees are both tips; they share an ancestor that was neither. (b) The orangutan lineage split off first, which describes where the split sits, not the animal; living orangutans have been evolving for exactly as long as we have. (c) Gorillas meet chimpanzees and humans at the same node, so they are equally related to both.
Build your own tree from sequences
Every primate tree in Figures 1 to 5 came from public data and free software. These are the exact steps to rebuild the ten-primate tree and then change it; if you only want to read trees, you can skip to the conclusion. Running them again in a clean folder reproduced the same alignment, model and tree.
What you need
The sequences: ten mitochondrial genomes from NCBI's public RefSeq collection, listed below.
MAFFT, which lines up the sequences (Katoh and Standley, 2013), and IQ-TREE, which builds the tree and its bootstrap values (Wong and colleagues, 2026). Both are free; this article used MAFFT 7.526 and IQ-TREE 3.1.4.
A tree viewer such as FigTree, a free desktop app that opens IQ-TREE's output.
On macOS or Linux, the quickest route is conda. Install Miniforge, then run conda create -n trees -c conda-forge -c bioconda mafft iqtree followed by conda activate trees. On Windows, use the Windows Subsystem for Linux. If you have IQ-TREE 2 instead, the program is called iqtree2 and the options below are the same.
Step 1: download the sequences
The ten genomes, in the order used here:
- NC_012920.1: Homo sapiens (human)
- NC_001643.1: Pan troglodytes (chimpanzee)
- NC_001644.1: Pan paniscus (bonobo)
- NC_011120.1: Gorilla gorilla gorilla (gorilla)
- NC_001646.1: Pongo pygmaeus (Bornean orangutan)
- NC_002083.1: Pongo abelii (Sumatran orangutan)
- NC_002082.1: Hylobates lar (lar gibbon)
- NC_005943.1: Macaca mulatta (rhesus macaque)
- NC_011137.1: Homo sapiens neanderthalensis (Neanderthal)
- NC_013993.1: Homo sp. Altai (Denisovan)
One command fetches all ten as a single FASTA file from NCBI's E-utilities service:
IDS=NC_012920.1,NC_001643.1,NC_001644.1,NC_011120.1,NC_001646.1,NC_002083.1,NC_002082.1,NC_005943.1,NC_011137.1,NC_013993.1
curl -sSf "https://eutils.ncbi.nlm.nih.gov/entrez/eutils/efetch.fcgi?db=nuccore&id=$IDS&rettype=fasta" > primates.fa
grep -c ">" primates.fa   # should print 10
Keep this order if you want exactly our numbers: MAFFT's result can shift slightly when the input order changes.
Step 2: start every genome at the same gene
Mitochondrial DNA is a circle, so each database record has to start somewhere, and these records do not agree. Six of them start at the tRNA-Phe gene. The other four (human, Neanderthal, Denisovan and macaque) start in the control region, 535 to 576 bases before that gene. This short Python script cuts each circle at tRNA-Phe and gives each genome a short name:
# rotate.py: start every mitochondrial genome at tRNA-Phe and give it a short name
import sys

MOTIF = "GTTTATGTAGCTTA"  # the first bases of tRNA-Phe in all ten genomes used here

seqs, name = {}, None
for line in open(sys.argv[1]):
    line = line.strip()
    if line.startswith(">"):
        # ">NC_012920.1 Homo sapiens mitochondrion, ..." becomes "Homo_sapiens"
        name = "_".join(line.split(" mitochondrion")[0].split()[1:])
        seqs[name] = []
    elif line:
        seqs[name].append(line.upper())

for name, parts in seqs.items():
    s = "".join(parts)
    i = s.find(MOTIF)
    if i < 0:
        sys.exit(f"{name}: start motif not found")
    print(f">{name}\n{s[i:]}{s[:i]}")
Run it with python3 rotate.py primates.fa > primates_rotated.fa. Skip this step and MAFFT still returns an alignment, but a worse one: 17,309 columns instead of 16,737, with about 1,300 columns where four or more of the ten genomes have a gap (about 200 after rotating). The control region sits at the start of four records and at the end of the other six, so MAFFT pads it with gaps at both ends.
Step 3: line the sequences up
mafft --auto primates_rotated.fa > primates_aligned.faThe result has 16,737 columns. Before building a tree, scroll through it in a free viewer such as Jalview: misaligned blocks are much easier to spot by eye than in the tree afterwards.
Step 4: build the tree
iqtree3 -s primates_aligned.fa -m MFP -b 100 -o Macaca_mulatta -T 4 --seed 2026 --prefix primates-m MFP asks IQ-TREE's ModelFinder (Kalyaanamoorthy and colleagues, 2017) to choose the best model of evolution for these data. It picked TVM+F+I+G4, a name that lists the model's parts: how often each pair of bases swaps (TVM), the base frequencies in the data (F), a share of sites that never change (I) and rates that vary from site to site (G4).
-b 100 runs 100 standard bootstrap replicates, the kind of support value explained above. It took 3 to 6 minutes on a recent laptop. For a quick answer, -B 1000 runs the ultrafast bootstrap instead: it took about 5 seconds here and gave the same tree with every value at 100. Its values are read against 95, not 70.
-o Macaca_mulatta draws the macaque as the outgroup. The tree itself stays unrooted, as the report warns.
-T 4 uses four processor cores, --seed 2026 makes the run repeatable (the last decimal places of branch lengths may still differ), and --prefix names the output files.
The tree is saved in primates.treefile in Newick format, the bracket notation most tree software reads:
((((((Homo_sapiens:0.0067937082,Homo_sapiens_neanderthalensis:0.0062693697)100:0.0063317003,Homo_sp._Altai:0.0124849086)100:0.0488636537,(Pan_troglodytes:0.0251450813,Pan_paniscus:0.0228778634)100:0.0382316652)100:0.0231369449,Gorilla_gorilla_gorilla:0.0833244252)100:0.0573259438,(Pongo_pygmaeus:0.0444390441,Pongo_abelii:0.0405411069)100:0.1199078793)100:0.0496266506,Hylobates_lar:0.1738899399,Macaca_mulatta:0.4387069447);Each pair of brackets is a clade. A number after a colon is a branch length in substitutions per site, and a number straight after a closing bracket is that clade's bootstrap value. The three items at the outermost level (the great apes, the gibbon and the macaque) are what makes the tree unrooted.
Step 5: open it and read it
Open primates.treefile in FigTree, a Java app; if macOS refuses to open it, right-click it and choose Open. When it asks what the node labels are, name them "bootstrap", then tick Node Labels and set Display to "bootstrap". Click the macaque's branch and choose Reroot: you now have the tree in Figure 3B, with the support values shown in Figure 4B.
Check the support values after rerooting. Some viewers attach them to the wrong branches when a tree is rerooted (Czech and colleagues, 2017), so make sure each value still sits on the grouping it belongs to.
Then change one thing at a time and read the result with the checklist above. Add a species, keep only one gene, or swap -b 100 for -B 1000, and see which parts of the tree hold firm and which move.
Conclusion
A phylogenetic tree is a hypothesis about history, drawn from evidence. Read it from the root, judge relatedness only by shared ancestors, and treat the order of the names as decoration. With that one rule, most of the trees that trip up exam candidates become straightforward to read.
The numbers on a tree deserve the same care as the shape. Branch lengths say how much change happened, support values say how consistently the data agree, and the sampling decides what the tree can say at all. As the 400-base experiment showed, too little data gives an unsettled tree, and support values usually, though not always, warn you.
The best way to make this stick is to build one. Run the commands above on the ten primates, swap in a species you care about, and watch what moves.
Further reading
Understanding evolutionary trees by T. Ryan Gregory (2008) is a free, thorough guide to tree thinking and its common errors.
The tree-thinking challenge by David Baum and colleagues (2005) is a short quiz that tests the ideas in this article.
The IQ-TREE documentation explains every option used to build this article's tree, with a beginner's tutorial.
FASTA, FASTQ, BAM and VCF: bioinformatics file formats explained covers the FASTA files you download in the first step of building a tree.
Reactions
From QuizLab
Test Your Knowledge
Quizzes on the same ground as this article. Pick one and see how much stuck.
- Cell BiologyIntermediateThe Cell Cycle & Mitosis14questionsStart Quiz
- Cell BiologyAdvancedCell Signaling Pathways12questionsStart Quiz
- Cell BiologyAdvancedCytoskeleton Dynamics9questionsStart Quiz
- EvolutionBeginnerNatural Selection9questionsStart Quiz
- EvolutionBeginnerEvidence for Evolution9questionsStart Quiz
- EvolutionIntermediateMechanisms of Evolution14questionsStart Quiz
Keep Reading
More from Scribe
Articles on related ground, and the newest from Scribe.
 Research Insights
AlphaFold 3 to IsoDDE: How AI Drug Discovery Got Twice as Accurate in 18 Months
DeepMind's AlphaFold 3 reshaped structural biology in 2024. By mid-2026, Isomorphic Labs' IsoDDE has more than doubled accuracy on the hardest protein-ligand systems.
biofideX5 min read Career Guidance
What Can You Do With a Biology Degree? Career Paths and the Skills Each One Needs
Choose the work, not the job title. A practical guide to biology careers: a typical day, the way in and the first skill for each path, which need a PhD, real UK graduate data, and how to test a path in a month.
biofideXOctober 14, 202626 min read Bioinformatics
FASTA, FASTQ, BAM and VCF: Bioinformatics File Formats Explained
A beginner's guide to the files every genomics project runs on. Follow one real coronavirus sample from FASTQ to BAM to VCF, decode quality scores, SAM flags and CIGAR strings, and avoid the off-by-one error that can hide a mutation.
biofideXOctober 14, 202640 min read Bioinformatics
How to Read a Volcano Plot: Fold Change, P-Values and FDR Explained
A beginner's guide to the most misread figure in genomics: what each axis means, why adjusted p-values matter, six ways the plot misleads, and how to draw one yourself in R or Python. Every figure uses real, public data.
biofideXOctober 14, 202629 min read