Lab Values Fishbone Diagram
How to read the lab values fishbone: the BMP (Chem 7) and CBC shorthand written on clinical notes, with each value's normal adult range.
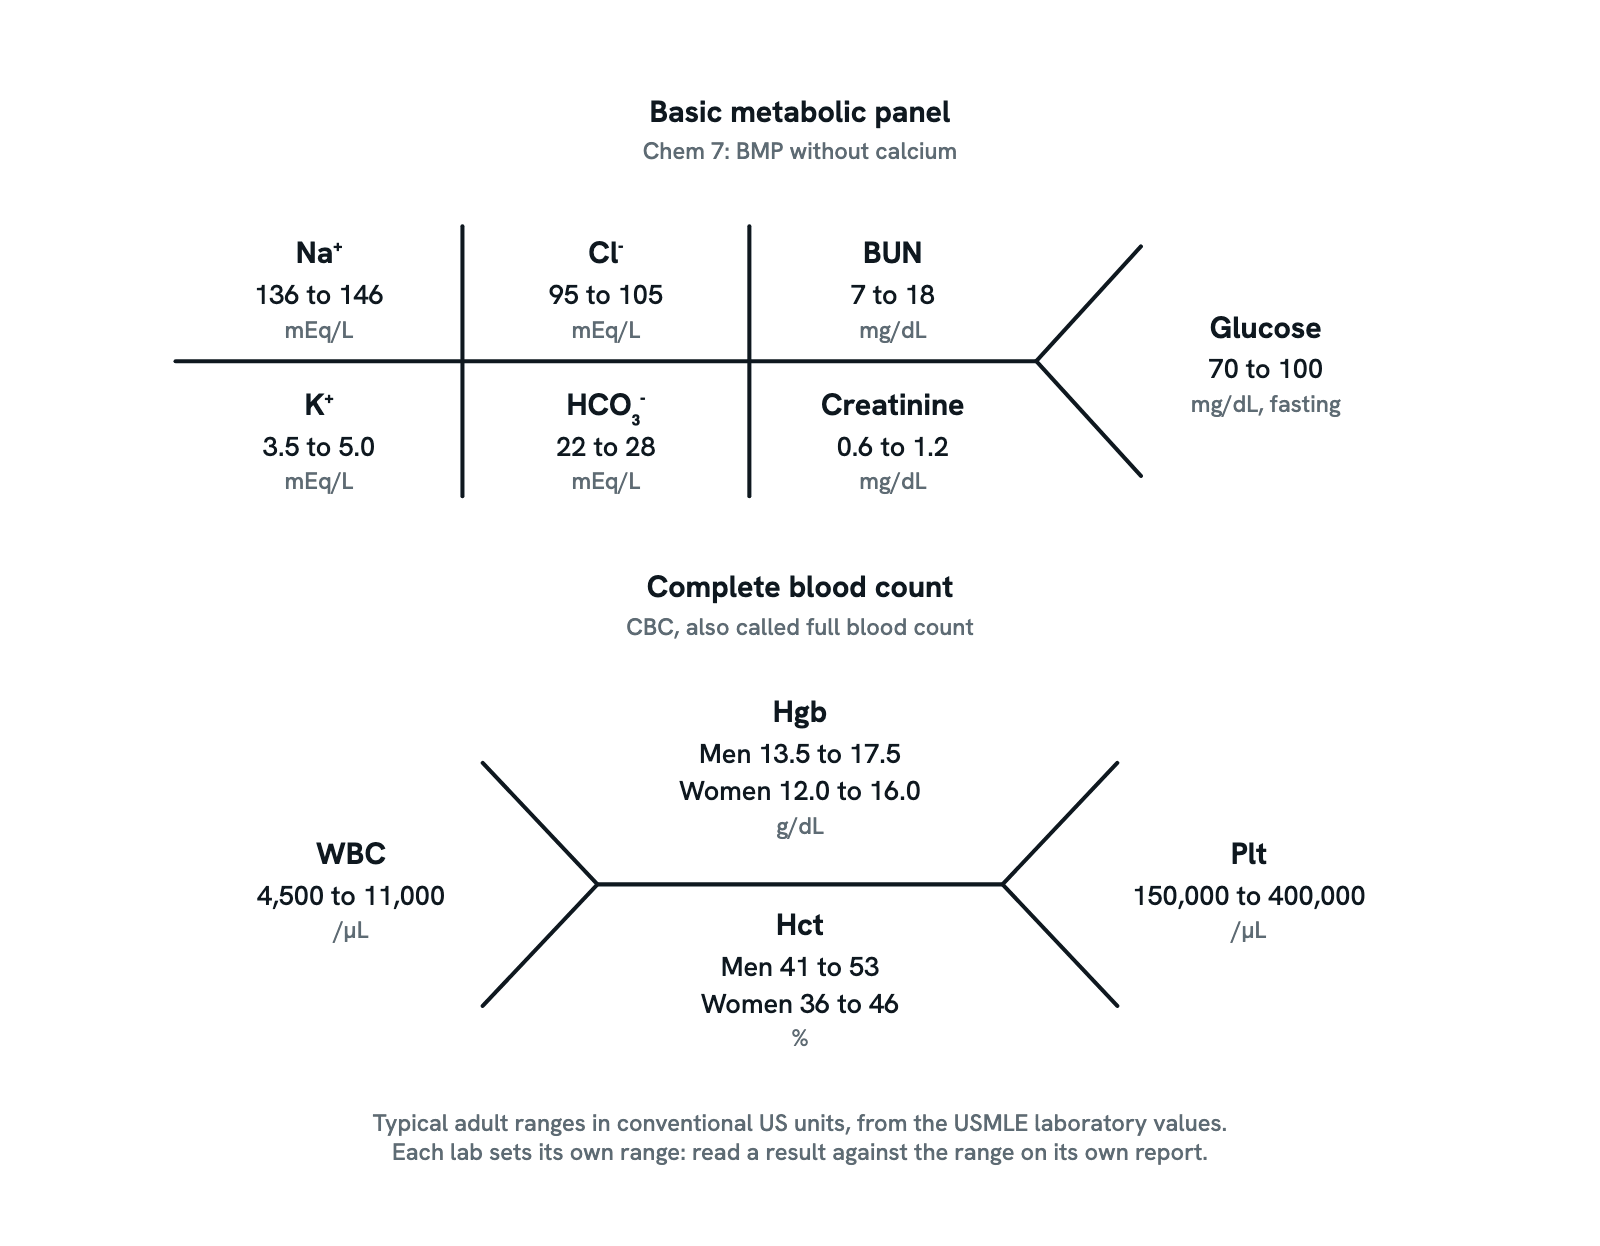
Clinicians often write a patient's lab results in fishbone shorthand, where a value's place on the lines says what it is. Here are the basic metabolic panel and the complete blood count, with each value's typical adult range in conventional US units. Ranges vary between labs, so read a real result against its own lab's range.
Also called Fishbone lab diagram, Lab skeleton diagram, Fishbone labs, BMP fishbone or CBC fishbone.
Press any part of the diagram, or pick one here, to see what it is and what it does.
Download the diagramChecked against its sources on 29 October 2026.
A tour
A tour of the lab values fishbone
01Lab values fishbone at a glance
A fishbone is shorthand that clinicians write on notes to record a lab panel. Each value has a fixed place on the lines, so its position says what it is. Two are drawn here, the basic metabolic panel and the complete blood count, with a typical adult range in each place. Ranges vary between labs; the patient's own lab's range is the one that counts.
02Reading the BMP
The BMP fishbone, or Chem 7, is a line crossed by two bars, ending in an open fork. Sodium, chloride and BUN sit on top; potassium, bicarbonate and creatinine below; glucose in the fork. The first two columns hold the electrolytes and the third the kidney's two wastes.
03Sodium and potassium
The first column pairs the two main cations: sodium outside cells, potassium inside them. Sodium mostly tracks water balance, and low sodium is the commonest electrolyte disorder. Potassium is watched closely because small changes either way can cause dangerous heart rhythms.
04Chloride and bicarbonate
The second column holds the two main anions measured. Chloride usually follows sodium, and bicarbonate, the blood's main base, tracks metabolic acid-base balance. Sodium minus chloride and bicarbonate gives the anion gap, an estimate of the anions the panel does not measure.
05BUN and creatinine
The third column holds two wastes the kidneys clear, and both rise when filtration falls. Creatinine is the steadier marker of kidney function. BUN also rises with dehydration or bleeding in the upper gut, so a BUN high out of proportion to creatinine suggests a cause before the kidney rather than in it.
06Glucose in the fork
Glucose sits alone in the open fork. The range drawn is for a fasting sample, and a random sample runs higher. A high fasting value can mean prediabetes or diabetes, which are diagnosed against set cut-offs, usually on two tests.
07Reading the CBC
The CBC fishbone is a short line with a fork at each end. The white cell count sits in the left fork and platelets in the right; hemoglobin goes above the line and hematocrit below. The full report holds more, such as the red cell indices, but these four are the ones written in the fishbone.
08Hemoglobin over hematocrit
The middle pair describe the red cells. A low hemoglobin defines anemia, and the hematocrit usually moves with it. Both have separate ranges for men and women, and both change with plasma volume: dehydration raises them, and fluid overload lowers them.
09White cells and platelets
A high white cell count is usually a response to infection or inflammation, and a low one can follow marrow suppression, viral infection or drugs. A low platelet count raises the risk of bleeding, though major bleeding is unusual until it falls well below the range.
Parts
What each part of the lab values fishbone does
- Basic metabolic panel (BMP)
- The fishbone holds seven of its tests, the Chem 7: sodium, chloride and BUN on top, potassium, bicarbonate and creatinine below, and glucose at the open fork. The full BMP also measures calcium. The places never change, so a value is read by where it sits.
- Sodium (Na⁺)
- The main cation outside cells. Its level follows water balance more than salt intake. Low sodium, the commonest electrolyte disorder, often means water held in excess, as in SIADH or heart failure; high sodium usually means water lost and not replaced.
- Potassium (K⁺)
- The main cation inside cells; small changes can upset the heart's rhythm. It runs low with loop diuretics or excess aldosterone, and high in kidney disease, acidosis or a lack of insulin. Cells that burst in a delayed sample can make it read falsely high.
- Chloride (Cl⁻)
- The main anion outside cells, which usually moves with sodium. It runs high after large volumes of normal saline or when diarrhea removes bicarbonate, and low with losses from vomiting.
- Bicarbonate (HCO₃⁻)
- The blood's main base, often reported as total CO₂. It falls in metabolic acidosis, for example when diarrhea carries bicarbonate out, and rises in metabolic alkalosis. It also shifts to make up for breathing problems.
- Blood urea nitrogen (BUN)
- The nitrogen in urea, which the liver makes from protein and the kidneys excrete. It rises when the kidneys clear less, and also with dehydration, bleeding in the upper gut or a high-protein diet. It falls in severe liver disease and starvation.
- Creatinine
- A waste product of muscle, made at a steady rate and cleared by the kidneys: the usual marker of kidney filtration and the basis of eGFR. It rises when filtration falls, though only after much function is lost, and runs lower in people with little muscle.
- Glucose
- Sugar in the plasma, the body's main fuel; the range shown is for a fasting sample. A fasting value of 100 to 125 mg/dL suggests prediabetes and 126 or more diabetes, usually confirmed by a second test. Low values are commonest in people treated with insulin or some diabetes pills.
- Complete blood count (CBC)
- The fishbone holds four of its values: the white cell count in the left fork, hemoglobin over hematocrit in the middle, and platelets in the right fork. The full report adds the red cell count, the red cell indices and usually a differential count of white cells.
- White cell count (WBC)
- All white cells in a microliter of blood. A high count (leukocytosis) is usually a response to infection, inflammation or stress; a low count (leukopenia) can follow marrow suppression, some viral infections or drugs.
- Hemoglobin (Hgb)
- The oxygen-carrying protein of red cells, in grams per deciliter of blood. A low value defines anemia, from blood loss, red cell destruction or poor production, such as in iron deficiency. A high value can reflect dehydration or extra red cell production.
- Hematocrit (Hct)
- The share of the blood's volume taken up by red cells. It usually moves with hemoglobin, falling in anemia and rising with extra red cell production, and like hemoglobin it is raised by dehydration and lowered by fluid overload.
- Platelet count (Plt)
- Cell fragments that start a clot. A low count comes from poor production, faster use or destruction, or pooling in the spleen; major bleeding is unusual above about 50,000/µL. A high count can be a reaction to marrow stimulation or a marrow disorder.
- Reference ranges
- Typical adult ranges in conventional US units, from the USMLE laboratory values that the site's lab table uses. Each lab sets its own range for its method and population, so a result is read against the range printed on its own report.
Dictionary
The terms to know
Practise it
The quizzes and cards that fit
- Medicine quizzes
- Labor and Delivery15 questions
- IV Fluids15 questions
- Sepsis15 questions
- Physiology quizzes
- Exercise Physiology15 questions
- Puberty15 questions
- Blood Clotting15 questions
- Medicine flashcards
The subject's terms as a ready-made deck, free to flip through.
- Normal Lab Values
Typical adult ranges for blood, urine and spinal fluid tests, in conventional and SI units, with a source for every value.
- mg/dL to mmol/L Converter
Convert glucose, cholesterol, creatinine, HbA1c and other results between conventional and SI units.
Next to it
More diagrams
Sources
Where the facts come from
- NBME: Laboratory Values (the table printed in USMLE and NBME exams)
- Peterson: Medical data formatting to improve physician interpretation speed in the Military Healthcare System, JAMIA Open 2022 (PMC)
- CMS: Table of Chemistry Panels, Medicare Claims Processing Manual, Transmittal 3619 (2016)
- StatPearls: Electrolytes (NCBI Bookshelf)
- StatPearls: Renal Function Tests (NCBI Bookshelf)
- StatPearls: Normal and Abnormal Complete Blood Count With Differential (NCBI Bookshelf)
- NIDDK: Diabetes Tests and Diagnosis
- NIDDK: Low Blood Glucose (Hypoglycemia)
Drawn and written by biofideX from these sources.