Oxygen-Hemoglobin Dissociation Curve
Hemoglobin saturation against PO₂: the S-shaped curve, P50, the arterial and venous points, and what shifts it.
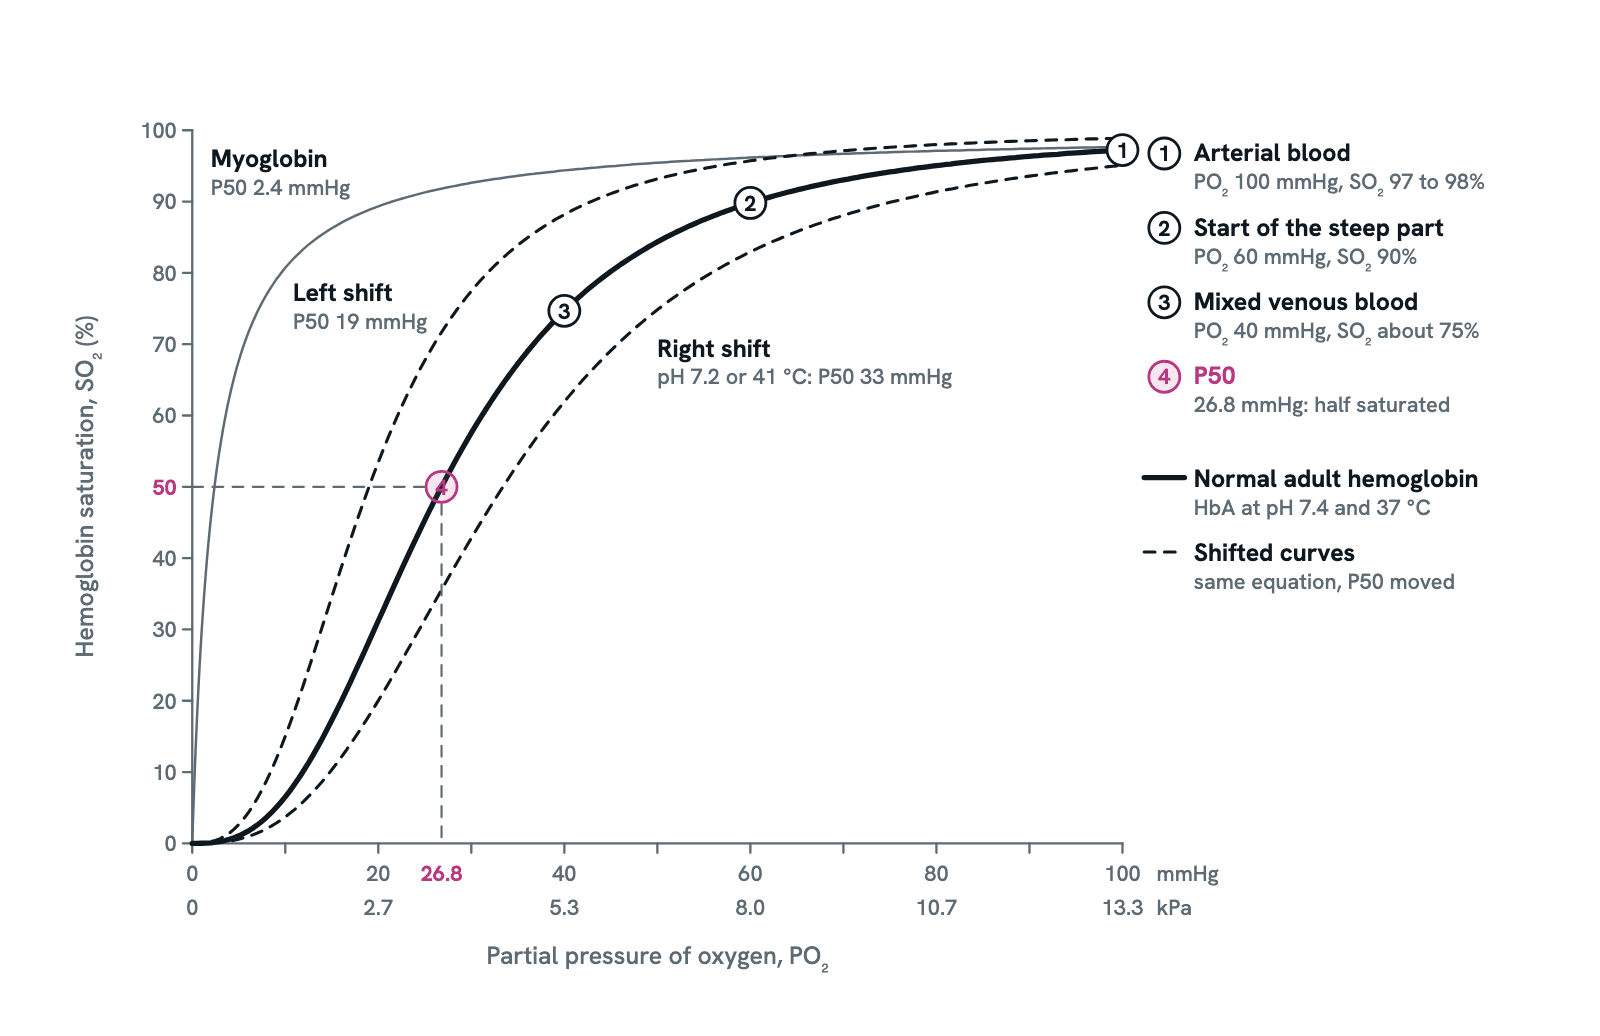
The oxygen-hemoglobin dissociation curve relates the oxygen dissolved in blood (PO₂) to the share of hemoglobin carrying it (SO₂). Its S shape explains how blood loads fully in the lungs yet gives up oxygen readily in the tissues, and why a pulse oximeter reading of 90% is a warning. The solid line is normal adult blood at pH 7.4 and 37 °C; dashed lines show it shifted right and left, and the thin line is myoglobin.
Also called Oxyhemoglobin dissociation curve, Oxygen dissociation curve, Hemoglobin saturation curve or ODC.
Press any part of the diagram, or pick one here, to see what it is and what it does.
Download the chartChecked against its sources on 5 November 2026.
How to read it
How to read the oxygen-hemoglobin dissociation curve
01The curve at a glance
The oxygen-hemoglobin dissociation curve plots how saturated hemoglobin is against the partial pressure of oxygen around it. The normal adult curve is the solid S-shaped line: nearly flat above 60 mmHg, where blood loads in the lungs, and steep below it, where blood unloads in the tissues. Dashed curves show it shifted right and left, and the thin curve is myoglobin. Press any entry to read it.
02Reading the axes
Across the bottom is PO₂, the oxygen dissolved in the blood, in mmHg with kilopascals beneath (1 kPa is 7.5 mmHg). Up the side is SO₂, the share of hemoglobin's binding sites holding oxygen. Dissolved oxygen is only about 3 ml per litre of blood and hemoglobin carries about 98% of the total, so saturation and the hemoglobin concentration, not PO₂, tell you how much oxygen the blood holds.
03Why it is S-shaped: cooperative binding
Hemoglobin is a tetramer of two alpha and two beta chains, each with one binding site. Empty, it sits in the tense (T) form, which binds oxygen reluctantly; the first oxygen tips it towards the relaxed (R) form, which binds the next three more easily. So saturation climbs slowly at low PO₂, then steeply, then flattens as the sites fill: a sigmoid. Unloading runs in reverse: losing one oxygen eases the loss of the rest.
04Loading in the lungs: the plateau
Arterial PO₂ is 80 to 100 mmHg at sea level, and blood leaves the lungs 97 to 98% saturated (point 1). Because the curve is flat here, a fall in PO₂ from 100 to 70 mmHg costs only about 4 points of saturation, from 97% to about 93%: a safety margin at altitude and in lung disease. In a normal lung the blood is fully loaded well before it leaves the capillary, so there is time to spare when exercise speeds the flow.
05Unloading in the tissues: the steep part
In the tissue capillaries PO₂ is low, about 40 mmHg in mixed venous blood, so hemoglobin is on the steep part and gives up a quarter of its oxygen, from 97% to about 75% (point 3). Every mmHg lost here frees far more oxygen than one lost on the plateau. That is the point of the shape: tight binding where PO₂ is high, in the lungs, and easy release where it is low, in the tissues.
06P50, the measure of affinity
P50 is the PO₂ at which half the sites are filled: 26.8 mmHg for normal adult blood at pH 7.4 and 37 °C (point 4; 27 in many texts). Everything that changes hemoglobin's affinity moves P50. A higher P50 means lower affinity and a curve shifted right; a lower P50 means higher affinity and a curve shifted left. Abnormal hemoglobins are described by their P50, and the dotted drop lines show how to read it off the graph.
07The Bohr effect
Carbon dioxide and acid lower hemoglobin's affinity for oxygen. Protons bind the protein and hold it in the T form, and CO₂ acts through the carbonic acid it forms and by binding the chains directly. Working tissue makes both, so the curve shifts right exactly where oxygen is needed; in the lungs CO₂ leaves, the pH rises and the shift reverses. The Haldane effect is the mirror image: hemoglobin that has given up oxygen carries more CO₂ and H⁺.
08The right shift: CADET, face right
CO₂, Acid, 2,3-BPG (DPG), Exercise and Temperature push the curve right and raise P50. Red cells make 2,3-BPG in glycolysis; it binds deoxyhemoglobin in the central cavity, stabilises the T form, and rises in chronic hypoxia, as at altitude. The dashed curve is drawn for pH 7.2, or equally for 41 °C: P50 about 33 mmHg. In exercising muscle, hot and acidic, P50 is estimated at 34 to 48 mmHg and unloading rises steeply.
09The left shift: holding on to oxygen
Alkalosis and low CO₂ (as in hyperventilation), cold and low 2,3-BPG raise affinity and shift the curve left: loading is easier, unloading harder. Stored red cells lose 2,3-BPG over about two weeks, so transfused blood starts left-shifted. Carbon monoxide binds hemoglobin 200 to 250 times more tightly than oxygen and raises the affinity of the sites it leaves free, shifting the curve far left: tissues starve while PO₂ and a pulse oximeter read normal.
10Myoglobin: one subunit, no cooperativity
Myoglobin, the oxygen store in muscle, has a single chain and a single heme, so there is no cooperativity: its curve is a hyperbola (Hill coefficient 1) with a P50 of about 2.4 mmHg at 37 °C. It is almost fully saturated at the PO₂ of muscle capillaries and releases oxygen only when the fibre's PO₂ falls very low, so it pulls oxygen from the blood into the working fibre.
11Fetal hemoglobin and the placenta
Fetal hemoglobin (HbF) has two alpha and two gamma chains in place of beta. It binds 2,3-BPG weakly, so its affinity is higher: P50 19 mmHg against 27 for HbA, the left-shifted dashed curve. In the placenta it takes oxygen from maternal blood, helped by a double Bohr effect: CO₂ leaving fetal blood shifts the fetal curve left, and entering maternal blood shifts the maternal curve right. HbF is replaced by HbA by 6 to 12 months of age.
12Reading a pulse oximeter against the curve
A pulse oximeter reports saturation (SpO₂), normally 95 to 100%, not PO₂. On the plateau a large fall in PO₂ barely moves it, so it hides both early hypoxaemia and dangerous hyperoxaemia. Point 2 is the warning line: SpO₂ 90% is a PO₂ of about 60 mmHg, and below it each further fall in PO₂ drops the reading fast. Carboxyhemoglobin and methemoglobin confuse the two wavelengths it uses, so confirm with a blood gas and co-oximetry when they are suspected.
Entries
What each part of the oxygen-hemoglobin dissociation curve shows
- Partial pressure of oxygen (PO₂)
- The oxygen dissolved in the blood, in mmHg with kilopascals beneath (1 kPa is 7.5 mmHg). Arterial blood at sea level runs at 80 to 100 mmHg, mixed venous blood at about 40. Dissolved oxygen is only about 3 ml per litre; hemoglobin carries the rest, about 98% of the total.
- Hemoglobin saturation (SO₂)
- The share of hemoglobin's binding sites that hold oxygen, 0 to 100%. A pulse oximeter estimates it as SpO₂; a blood gas analyser measures it as SaO₂. It says nothing about how much hemoglobin there is: an anaemic patient can read close to 100% with a low oxygen content.
- Steep part (unloading in the tissues)
- Below about 60 mmHg a small fall in PO₂ releases a lot of oxygen, because once one subunit lets go the others follow. This is the range of the tissue capillaries, where PO₂ is low: blood arrives 97% saturated and leaves at about 75% at rest.
- Plateau (loading in the lungs)
- Above about 60 mmHg the curve is nearly flat and saturation stays above 90%. Arterial PO₂ can fall from 100 to 70 mmHg, at altitude or with lung disease, and saturation only slips from 97% to about 93%. In a normal lung the blood is fully loaded well before it leaves the capillary.
- 1. Arterial blood
- PO₂ about 100 mmHg, saturation 97 to 98%: blood leaving normal lungs at sea level. The curve is so flat here that extra oxygen raises PO₂ but adds almost no saturation, only a little dissolved oxygen; 100% needs a PO₂ above about 128 mmHg (17 kPa).
- 2. 60 mmHg, 90%: where the steep part begins
- Above this point saturation changes slowly; below it the curve steepens and saturation falls fast for every mmHg lost, a slippery slope. Hypoxaemia is defined as a saturation under 90%, which on this curve is a PO₂ under about 60 mmHg (8 kPa).
- 3. Mixed venous blood
- PO₂ about 40 mmHg, saturation about 75%: the blood returning to the right heart in healthy people at rest. Only a quarter of the oxygen has been unloaded, a reserve the body draws on in exercise. The acid, CO₂ and warmth of working tissue shift the curve right as blood passes, so more is released.
- 4. P50
- The PO₂ at which hemoglobin is half saturated: 26.8 mmHg for normal adult blood at pH 7.4 and 37 °C, often rounded to 27. It is the standard measure of affinity, measured in vitro: a higher P50 means lower affinity and a right-shifted curve, a lower P50 higher affinity and a left shift.
- Right shift (lower affinity)
- Drawn for pH 7.2, or equally for 41 °C: P50 rises to about 33 mmHg, so at any PO₂ less oxygen stays bound and more is unloaded. More CO₂, more acid, higher temperature and more 2,3-BPG all shift the curve this way, and all four meet in exercising muscle.
- Left shift (higher affinity)
- Drawn for fetal hemoglobin, P50 19 mmHg: at any PO₂ more oxygen stays bound, so loading is favoured and unloading is harder. Less CO₂ (hyperventilation), alkalosis, cold, the low 2,3-BPG of stored blood and carbon monoxide shift the adult curve the same way.
- Myoglobin
- The oxygen store of muscle has a single subunit, so it cannot bind cooperatively: its curve is a hyperbola, not a sigmoid, with a P50 of about 2.4 mmHg (measured at 37 °C and pH 7.0). It is nearly saturated at tissue PO₂ and lets go only when the fibre's PO₂ falls very low, so it pulls oxygen out of the blood.
As a table
The oxygen-hemoglobin dissociation curve as a table
The factors that move the oxygen-hemoglobin dissociation curve, the way each moves P50, and where it acts.
More CO₂
- Shifts the curve
- Right
- P50
- Up
- Effect on oxygen delivery
- More oxygen unloaded at the same PO₂ (the Bohr effect)
- Where it happens
- Working tissue, where CO₂ is made
More H⁺ (acidosis, lower pH)
- Shifts the curve
- Right
- P50
- Up: about 33 mmHg at pH 7.2
- Effect on oxygen delivery
- More oxygen unloaded; protons hold hemoglobin in the T form
- Where it happens
- Exercising muscle; CO₂ retention in respiratory failure
Higher temperature
- Shifts the curve
- Right
- P50
- Up: about 33 mmHg at 41 °C
- Effect on oxygen delivery
- More oxygen unloaded
- Where it happens
- Exercising muscle, which warms from 37 to about 41 °C
More 2,3-BPG
- Shifts the curve
- Right
- P50
- Up
- Effect on oxygen delivery
- More oxygen unloaded; 2,3-BPG binds deoxyhemoglobin and stabilises the T form
- Where it happens
- Chronic hypoxia, as at altitude; trained athletes
Exercise (all four together)
- Shifts the curve
- Right
- P50
- Up: 34 to 48 mmHg estimated in working muscle
- Effect on oxygen delivery
- Unloading in the capillaries rises steeply
- Where it happens
- Working skeletal muscle
Less CO₂, alkalosis (higher pH)
- Shifts the curve
- Left
- P50
- Down: about 21.5 mmHg at pH 7.6
- Effect on oxygen delivery
- Less oxygen unloaded; loading favoured
- Where it happens
- Hyperventilation; the lungs, as CO₂ leaves the blood
Lower temperature
- Shifts the curve
- Left
- P50
- Down
- Effect on oxygen delivery
- Less oxygen unloaded
- Where it happens
- Cooled blood or tissue
Less 2,3-BPG
- Shifts the curve
- Left
- P50
- Down
- Effect on oxygen delivery
- Less oxygen unloaded
- Where it happens
- Red cells stored for transfusion beyond about two weeks
Carbon monoxide
- Shifts the curve
- Left
- P50
- Down
- Effect on oxygen delivery
- Oxygen held on the remaining sites while CO takes the rest: tissue hypoxia with a normal PO₂
- Where it happens
- Carbon monoxide poisoning, including smoke from fires
Fetal hemoglobin (HbF, two alpha and two gamma chains)
- Shifts the curve
- Left
- P50
- 19 mmHg (HbA 27)
- Effect on oxygen delivery
- Takes oxygen from maternal blood across the placenta
- Where it happens
- The fetus; replaced by HbA by 6 to 12 months of age
Shifted P50 values are computed with the relation Okada and colleagues fitted to Severinghaus's standard curve: log P50 rises by 0.48 for each unit fall in pH and by 0.024 for each degree Celsius, from 26.8 mmHg at pH 7.4 and 37 °C. The exercise estimate comes from blood gases of working muscle (Mairbäurl 2013).
Dictionary
The terms to know
Practise it
The quizzes and cards that fit
- Physiology quizzes
- Exercise Physiology15 questions
- Puberty15 questions
- Blood Clotting15 questions
- Medicine quizzes
- Labor and Delivery15 questions
- IV Fluids15 questions
- Sepsis15 questions
- Biochemistry quizzes
- Photosynthesis and Cellular Respiration15 questions
- Molarity and Dilutions15 questions
- ATP and Cellular Energy15 questions
- Physiology flashcards
The subject's terms as a ready-made deck, free to flip through.
- Normal Lab Values
Typical adult ranges for blood, urine and spinal fluid tests, in conventional and SI units, with a source for every value.
Next to it
More diagrams
Sources
Where the facts come from
- StatPearls: Physiology, Oxyhemoglobin Dissociation Curve (Kaufman, Kandle, Murray and Dhamoon, NCBI Bookshelf)
- StatPearls: Physiology, Bohr Effect (Benner, Patel, Singh and Dua, NCBI Bookshelf)
- StatPearls: Physiology, Fetal Hemoglobin (Kaufman, Khattar and Lappin, NCBI Bookshelf)
- Taggarsi and Krishna: Placenta in the Critically Ill Mother, Indian Journal of Critical Care Medicine 2021 (PMC), on the double Bohr effect
- StatPearls: Pulse Oximetry, archived chapter (Torp, Modi, Pollard and Simon, NCBI Bookshelf)
- StatPearls: Carbon Monoxide Toxicity, archived chapter (McMahon and Launico, NCBI Bookshelf)
- Severinghaus: Simple, accurate equations for human blood O2 dissociation computations, Journal of Applied Physiology 1979 (PubMed)
- Dash, Korman and Bassingthwaighte: Simple accurate mathematical models of blood HbO2 and HbCO2 dissociation curves at varied physiological conditions, European Journal of Applied Physiology 2016 (PMC)
- Mairbäurl: Red blood cells in sports: effects of exercise and training on oxygen supply by red blood cells, Frontiers in Physiology 2013 (PMC)
- Mairbäurl and Weber: Oxygen transport by hemoglobin, Comprehensive Physiology 2012 (PubMed)
- Collins and others: Relating oxygen partial pressure, saturation and content: the haemoglobin-oxygen dissociation curve, Breathe 2015 (PMC)
- Schenkman, Marble, Burns and Feigl: Myoglobin oxygen dissociation by multiwavelength spectroscopy, Journal of Applied Physiology 1997 (PubMed)
- Nitzan, Romem and Koppel: Pulse oximetry: fundamentals and technology update, Medical Devices: Evidence and Research 2014 (PMC)
- Jubran: Pulse oximetry, Critical Care 2015 (PMC)
- Chu and others: Simulated oxygen supply efficiency assessment to represent stored red blood cells quality, Life 2026 (PMC), on the loss of 2,3-DPG in stored red cells
Drawn and written by biofideX from these sources.